A word of caution about short-living rallies within a long drawn market weakness would be apt.
ET Intelligence Group: A sharp fall in the stock market over the past few weeks may have made the prices of several stocks look attractive, thus tempting investors to make fresh purchases. But this may prove to be risky. Data over the past 20 years show that a double-digit fall from the peak in market indices within a month often results in a prolonged weakness contrary to investors’ expectations of a turnaround. The current fall, which has resulted in 28 per cent drop in the benchmark indices at the end of Tuesday’s trading session from the peak on January 20, is a part of a global selloff due to the uncertain economic growth amid the outbreak of Covid-19.
First of such double-digit drops from the peak was in March 2000 amid the dot-com bubble burst. The Nifty 50 fell by over 10 per cent that month and continued to slide for the next 18 months, tanking by almost 50 per cent from the peak.
Once the bottom was formed in 2003, markets started climbing and the rally continued until the beginning of 2008. Indices hit a lower circuit in the middle of January 2008 and the fall continued for 15 months due to subprime crisis in the US, resulting in over 60 per cent drop from the peak. The indices picked up after that and continued to gain the lost ground until end of 2010.
These charts tell you where the money is
1/10
Indian equity markets have corrected significantly over the last one month (Nifty down ~26% from its 52-week high of 12,362 to the lows of 16th March 20) in tandem with global equity markets due to headwinds from the Covid-19 outbreak across multiple countries. However, such significant corrections have opened up equally significant investment opportunities in the past. Here are some important investment parameters across cycles in the last two decades and a few investment bets. (Source: MOSL)
Indian equity markets have corrected significantly over the last one month (Nifty down ~26% from its 52-week high of 12,362 to the lows of 16th March 20) in tandem with global equity markets due to h..
Read More
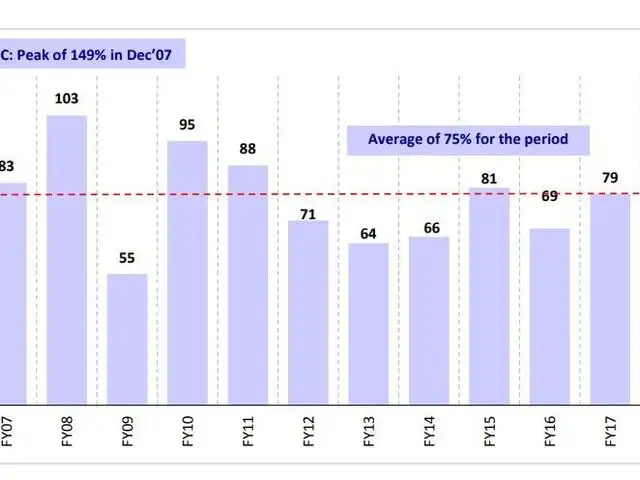
Market cap-to-GDP ratio has fallen swiftly from 79% as on FY19 to 58% (FY20E GDP) – much below long-term average of 75% and closer to levels last seen during FY09. The ratio has been quite stable over FY15-19 in the 70-80% band. The lowest in the last two decades has been 42% in FY04. However, the number of listed and traded companies then were much lower than today. The ratio hit a peak of 149% in December 2007 during the 2003-08 bull run.
Market cap-to-GDP ratio has fallen swiftly from 79% as on FY19 to 58% (FY20E GDP) – much below long-term average of 75% and closer to levels last seen during FY09. The ratio has been quite stable ove..
Read More
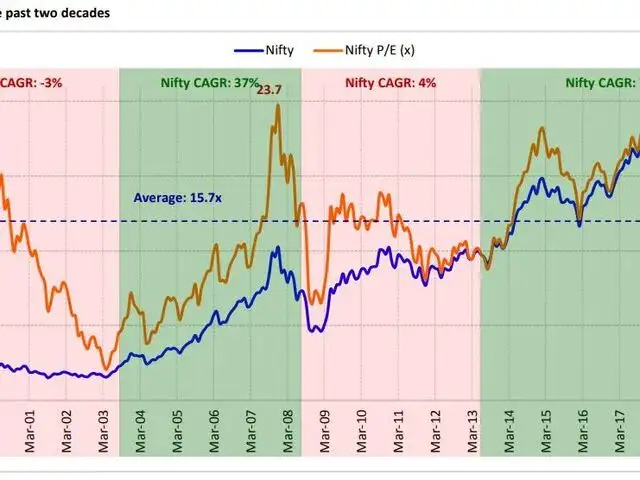
The last two decades saw several phases and cycles in the Nifty where valuations have mean-reverted even as earnings drove long-term markets returns. Post the recent fall, the Nifty returns CAGR since March 13 stands at 7%, almost mirroring the earnings CAGR.
The last two decades saw several phases and cycles in the Nifty where valuations have mean-reverted even as earnings drove long-term markets returns. Post the recent fall, the Nifty returns CAGR sinc..
Read More
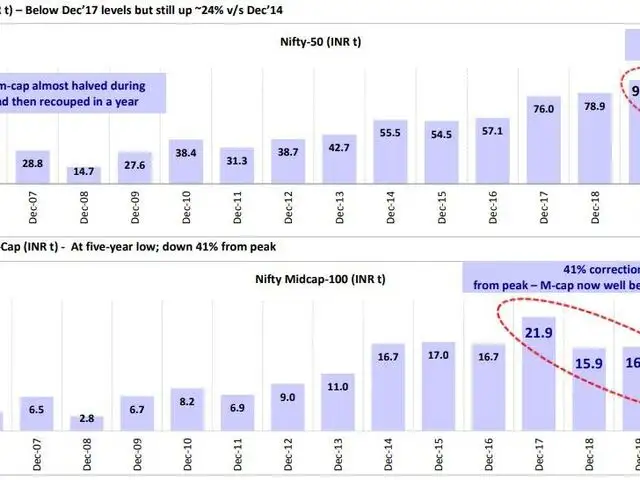
Nifty-50 market cap has corrected 23% from December 2019 levels and has now slipped below the December 2017 mark. The muted 4% CAGR since December 2014 is symptomatic of the tepid corporate earnings cycle. Nifty Midcap-100 market cap is down 41% from peak and 23% below December 2014 levels.
Nifty-50 market cap has corrected 23% from December 2019 levels and has now slipped below the December 2017 mark. The muted 4% CAGR since December 2014 is symptomatic of the tepid corporate earnings ..
Read More
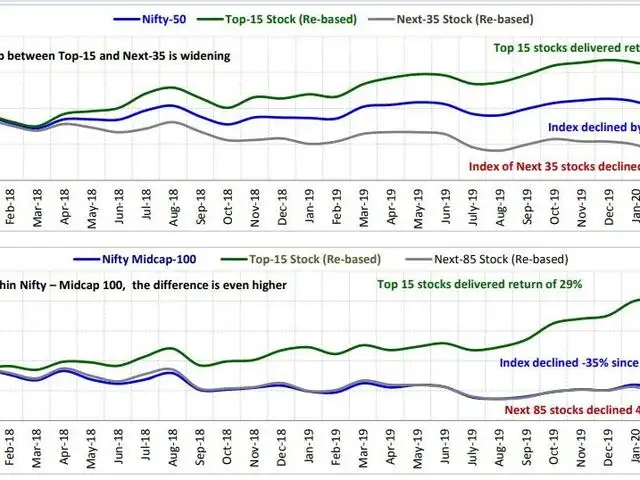
Market polarization has continued with Nifty top 15 gaining 10% and the other 35 Nifty constituents (Nifty-35) down 36% since December 2017. YTD, Nifty top 15 are down 24%, while the other 35 stocks have declined by 27%. The divide is starker in mid-caps. Since December 2017, Nifty Midcap-100 has corrected 35%, with the top 15 stocks delivering 29% gains but the remaining 85 stocks declining by 40%. YTD, the top 15 stocks are down 8%, while the other 85 stocks are down by 26%.
Market polarization has continued with Nifty top 15 gaining 10% and the other 35 Nifty constituents (Nifty-35) down 36% since December 2017. YTD, Nifty top 15 are down 24%, while the other 35 stocks ..
Read More
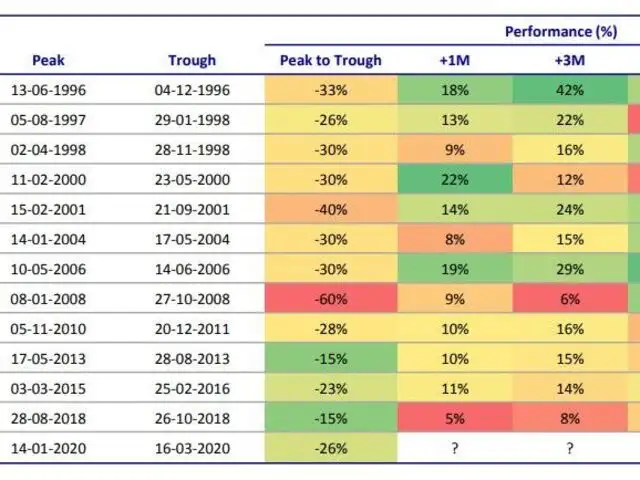
If history is to go by, markets usually rebound the most in 3-6 months post sharp corrections. Except one instance during the Tech meltdown of 2000, markets have delivered positive returns in the subsequent 12-month period. On an average, it takes about 156 days between peak to trough - the lowest has been 35 days in 2006 and the highest 410 days in Nov 2010-Dec 2011.
If history is to go by, markets usually rebound the most in 3-6 months post sharp corrections. Except one instance during the Tech meltdown of 2000, markets have delivered positive returns in the sub..
Read More
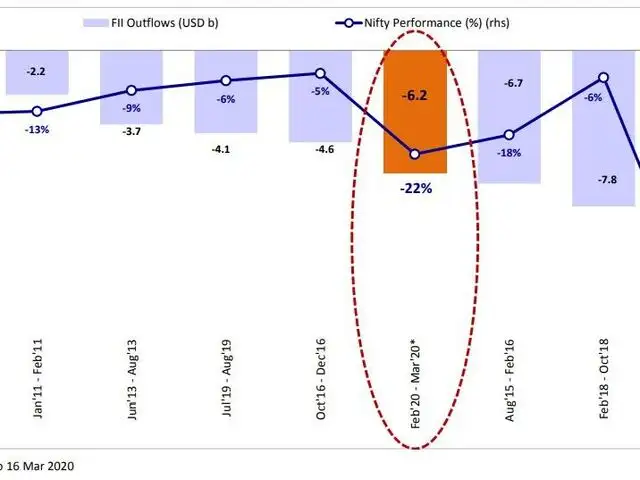
Sharp bout of FII outflow has often acted as a catalyst for significant market correction in a short period of time in the past. In the current episode, FIIs have offloaded $6.2b in less than a month with underlying market correction of 20%+.
Sharp bout of FII outflow has often acted as a catalyst for significant market correction in a short period of time in the past. In the current episode, FIIs have offloaded $6.2b in less than a month..
Read More
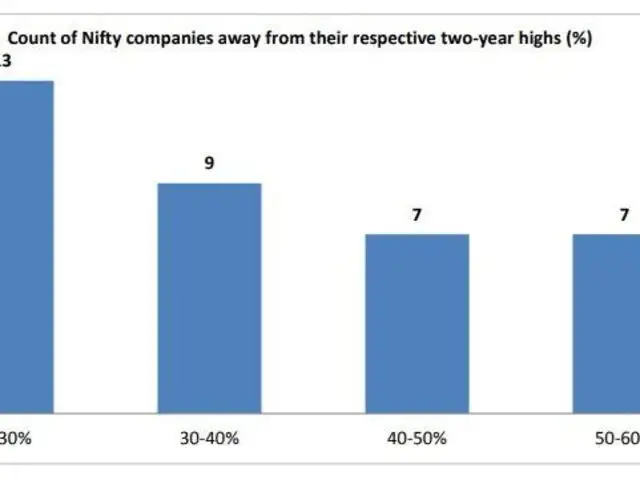
More than two fifths of the Nifty constituents are >40% down from their respective two-year highs, while 12% of companies are about <20% down from two-year highs. Companies closest to their two-year highs: APNT (12%), Nestle (15%), HUL (16%), Dr. Reddy (16%) and Bharti (18%).
More than two fifths of the Nifty constituents are >40% down from their respective two-year highs, while 12% of companies are about <20% down from two-year highs. Companies closest to their two-year ..
Read More
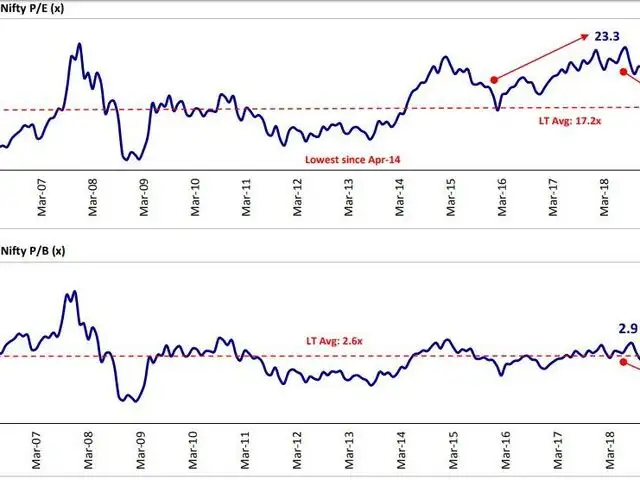
Nifty 12-month forward P/E of 15.1x is at a 12% discount to LT average of 17.2x (March 2005) and at levels last seen in February 2014. At 2.0x, the Nifty 12-month forward P/B is also well below the historical average of 2.6x. We have assumed a 10% cut in our FY21 Nifty earnings estimates to account for the disruption due to the global pandemic.
Nifty 12-month forward P/E of 15.1x is at a 12% discount to LT average of 17.2x (March 2005) and at levels last seen in February 2014. At 2.0x, the Nifty 12-month forward P/B is also well below the h..
But once again a double-digit fall in January 2011 continued for 12 months before the markets bottomed out. The only exception during the period of two decades was a sharp fall in May 2004, which was event-driven. The UPA had won mandate to form the government at the centre, much against expectations of the market participants. As a result, the Nifty lost over 11 per cent in a day but recovered in just two trading sessions and continued to scale new peaks in the next four years.
A word of caution about short-living rallies within a long drawn market weakness would be apt. During the past instances of an extended weakness in indices, there were pull back rallies lasting for short durations. In the hindsight, investors were better off selling in those rallies rather than buying into them. For instance, in 2008, after correcting in the first three months by 15 per cent, Sensex gained 11 per cent in April, only to fall by 22 per cent in the following two months.