Nestle, HUL, Pfizer, NTPC among 12 stocks that analysts say can deliver gains over next 2-3 weeks
Analysts said investors should adopt a stock-specific approach in this market.
By Nishant Kumar, ETMarkets.com |

Getty Images
NEW DELHI: Domestic stocks witnessed solid gains in morning trade on Monday, mirroring a similar trends in other Asian markets as sentiment got a boost after the US and China had made significant progress towards a trade truce.
The revival of monsoon after a slow initial phase also influenced market mood. All eyes are now on the Union Budget with hopes that the government may announce measures to boost liquidity and announce policies to strengthen agriculture and infrastructure sectors to accelerate growth.
Some analysts said investors should adopt a stock-specific approach in this market to be able to maximise gains and minimise losses.
Based on the recommendations of various analysts and brokerages, here is a list of 12 stocks that they say can potentially deliver gains over the next 2-3 weeks.
Aditya Agarwala, Senior Manager, Technical Analysis, YES Securities
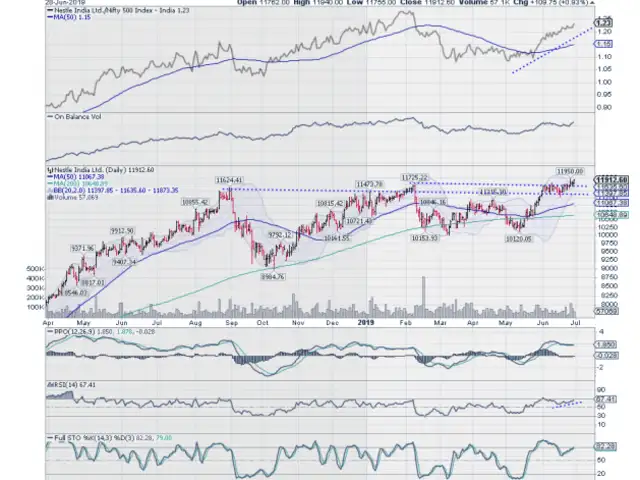
Nestle (India) | Buy | Target price: Rs 12,500-13,000 | Stop loss: Rs 11,550
On the weekly chart, Nestle has broken out from an ascending triangle pattern neckline placed at Rs 11,600, triggering a resumption in the bullish trend. Sustained trade above Rs 11,950 will extend the bounce, taking it higher to Rs 12,500-13,000 levels. On the daily chart, the stock is making higher highs and lows after breaking out of the consolidation phase, confirming the bull trend. The RSI has turned upward after taking support at the 60-level on the daily chart, suggesting bullishness in the stock.
Can Fin Homes | Buy | Target price: Rs 385-405 | Stop loss: Rs 330
On the daily chart, Can Fin Homes is on the verge of a breakout from a triangle pattern, suggesting bullishness on the counter. A sustained trade above Rs 360 will trigger a breakout from the pattern and take it higher to Rs 385-405 levels. On the weekly chart, the stock is on the verge of a breakout from a rounding bottom pattern neckline placed at Rs 370. This breakout and a weekly close beyond this neckline would trigger a massive bounce in the stock. The RSI has formed a positive reversal at the 45-level and turned north indicating bullishness dominant in the stock.
Nagaraj Shetti, Senior Technical & Derivatives Analyst, HDFC Securities
Union Bank of India | Buy | Target price: Rs 91 | Stop loss: Rs 75
The weekly timeframe chart of Union Bank of India indicated the formation of a near-term bottom reversal pattern. After showing a consolidation type of movement in the last one month, the stock has broken above the consolidation recently and closed higher. "We also observe a consistent higher bottom formations over the last many months, which signals a possibility of further upside in the near-term," said Shetti. Volume has also expanded recently with the rise in the stock price.
The positive sequence of higher tops and bottoms over the last few months, as per the weekly charts, has shown a consistent bounce in this stock. After showing a minor downward correction in the last few weeks, the stock price recently has moved up sharply and closed higher. This indicates at the emergence of buying interest from the lows. “Volume has expanded along with the upside breakout in the stock price. Weekly RSI has turned up from near 60 levels, which indicates a further strengthening of upside momentum in the stock prices ahead,” said Shetti.
Vikas Jain, Senior Research Analyst, Reliance Securities
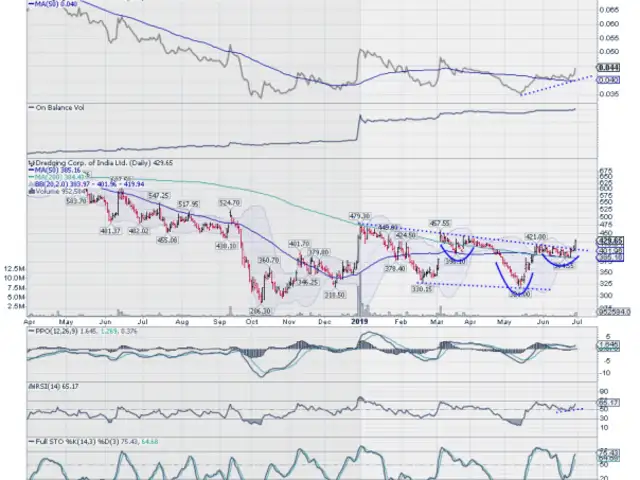
This stock has found support near its 13-month averages after a sharp fall from the high of Rs 366 over the past few weeks. “As per the set-up, we believe, price-wise and time-wise correction is over and crossover of the short term averages will give a sharp bounce,” Jain said. A positive crossover in RSI and a rise in Stochastic from its oversold zone are indicating a probable turnaround in the stock.
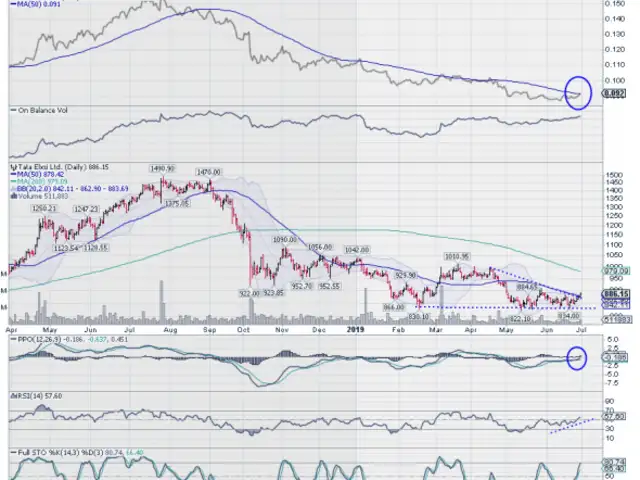
Tata Elxsi | Buy | Target price: Rs 980 | Stop loss: Rs 840
This stock has been trading in the range of Rs 830-890 levels over the past 8 weeks and has completed 61.8 per cent retracement of the entire move from (Rs 511-1,491). The convergence of key technical indicators with recent turnaround is indicating at a bullish trend reversal in the stock. "In case of any decline, recent swing low will work as a key reversal point for the stock," Jain said.
Rajesh Bhosale, Technical Analyst, Angel Broking
Mphasis | Buy | Target price: Rs 1,135 | Stop loss: Rs 933
On the daily chart, the stock has seen a bullish range breakout known as ‘Rectangular Channel’ , after trading in a broad range between Rs 920 and Rs 1,000 levels for last two months. Historically, after witnessing stiff resistance on 200-DMA for five times in last eight months, the prices have closed above the same, confirming a bullish turn around in the trend. The aforesaid breakout was accompanied by a good increase in volume and positive placement of momentum oscillator. "Last week, we witnessed a lot of buzz in the midcap IT space and now with the above breakout, we sense a strong upside in the counter," said Bhosale.
Pfizer | Buy | Target price: Rs 3,590 | Stop loss: Rs 3,220
During the recent turbulence within the pharma space, this stock was a sheer outperformer. It has been continuously forming higher tops and bottoms and after a brief consolidation of three months, a bullish continuation of head and shoulder breakout on the daily chart was witnessed. The said breakout is supported by the price closing above the higher end of the Bollinger band, which signalled a trending upward move after a period of consolidation. Prices are well above major moving averages i.e. 20,50,200D-SMA and momentum oscillators are placed in positive zone, supporting the bullish view on the counter.

Indian market last week continued to remain on the edge ahead of Union Budget and a much-awaited meeting between the US President Donald Trump and his Chinese counterpart Xi Jinping. With both the leaders agreeing to a trade truce, progress in monsoon and Budget remain the key factors that will guide Dalal Street this week.
Here are some short-term stock recommendations that give decent returns to investors during the Budget week:
Mustafa Nadeem, CEO, Epic Research
NTPC | Buy | Target price: Rs 160 | Stop loss: Rs 134
As per price pattern, NTPC has seen a breakout from an inverted head and shoulder pattern, while at the same time, it has closed above its resistance trendline drawn from peaks of 2017. The volume has seen a jump recently which indicates decisiveness of the trend. There is a positive crossover of 20-day and 50-day SMAs as well. The RSI is touching 70 level, which indicates strength and the stock can move further to higher targets of Rs 160 in the coming days.
Hindustan Zinc | Buy| Target price: Rs 268 | Stop loss: Rs 230
A double bottom has formed on a larger timeframe chart of this stock with prices taking support at the price level last seen in 2017. The RSI has further jumped above 50 after an extended bearish trend and is now indicating at returning strength. The stock on the weekly chart has taken very good support of its 200-day SMA, which may provide short-term relief and a short-term upside that can take prices to Rs 268 in the coming days.
Vaishali Parekh, Senior Technical Analyst at Prabhudas Lilladher
Indraprastha Gas | Buy | Target price: Rs 340 | Stop loss: Rs 306
This stock has witnessed a decent erosion recently and taken support near the Rs 308 level, which is also the trendline support base connecting previous major bottoms. The RSI indicates a trend reversal from near the oversold zone and given a buy signal. “With good volume participation witnessed and the chart looking attractive, we recommend a buy in this stock for an upside target of Rs 340, keeping a stop loss of Rs 306," said Parekh.
Hindustan Unilever (HUL) | Buy | Target price: Rs 1,860 | Stop loss: Rs 1,745
This stock has formed a higher bottom formation pattern on the daily chart, taking support near Rs 1,745 level which is also near the 50DMA. It has currently indicated a bounce back with a positive bias to imply further upward move to retrace the previous peak level. The RSI has indicated a trend reversal to signal a buy. "With good consistent volume participation witnessed, we recommend a buy in this stock for an upside target of Rs 1,860, keeping a stop loss of Rs 1,745," said Parekh.
(Views and recommendations given in this section are the analysts’ own and do not represent those of ETMarkets.com. Please consult your financial adviser before taking any position in the stock/s mentioned.)
The revival of monsoon after a slow initial phase also influenced market mood. All eyes are now on the Union Budget with hopes that the government may announce measures to boost liquidity and announce policies to strengthen agriculture and infrastructure sectors to accelerate growth.
Some analysts said investors should adopt a stock-specific approach in this market to be able to maximise gains and minimise losses.
Based on the recommendations of various analysts and brokerages, here is a list of 12 stocks that they say can potentially deliver gains over the next 2-3 weeks.
Aditya Agarwala, Senior Manager, Technical Analysis, YES Securities
Nestle (India) | Buy | Target price: Rs 12,500-13,000 | Stop loss: Rs 11,550
On the weekly chart, Nestle has broken out from an ascending triangle pattern neckline placed at Rs 11,600, triggering a resumption in the bullish trend. Sustained trade above Rs 11,950 will extend the bounce, taking it higher to Rs 12,500-13,000 levels. On the daily chart, the stock is making higher highs and lows after breaking out of the consolidation phase, confirming the bull trend. The RSI has turned upward after taking support at the 60-level on the daily chart, suggesting bullishness in the stock.
ADVERTISEMENT
Can Fin Homes | Buy | Target price: Rs 385-405 | Stop loss: Rs 330
On the daily chart, Can Fin Homes is on the verge of a breakout from a triangle pattern, suggesting bullishness on the counter. A sustained trade above Rs 360 will trigger a breakout from the pattern and take it higher to Rs 385-405 levels. On the weekly chart, the stock is on the verge of a breakout from a rounding bottom pattern neckline placed at Rs 370. This breakout and a weekly close beyond this neckline would trigger a massive bounce in the stock. The RSI has formed a positive reversal at the 45-level and turned north indicating bullishness dominant in the stock.
Nagaraj Shetti, Senior Technical & Derivatives Analyst, HDFC Securities
Union Bank of India | Buy | Target price: Rs 91 | Stop loss: Rs 75
The weekly timeframe chart of Union Bank of India indicated the formation of a near-term bottom reversal pattern. After showing a consolidation type of movement in the last one month, the stock has broken above the consolidation recently and closed higher. "We also observe a consistent higher bottom formations over the last many months, which signals a possibility of further upside in the near-term," said Shetti. Volume has also expanded recently with the rise in the stock price.
ADVERTISEMENT
Siemens | Buy | Target price: Rs 1,415 | Stop loss: Rs 1,235The positive sequence of higher tops and bottoms over the last few months, as per the weekly charts, has shown a consistent bounce in this stock. After showing a minor downward correction in the last few weeks, the stock price recently has moved up sharply and closed higher. This indicates at the emergence of buying interest from the lows. “Volume has expanded along with the upside breakout in the stock price. Weekly RSI has turned up from near 60 levels, which indicates a further strengthening of upside momentum in the stock prices ahead,” said Shetti.
Vikas Jain, Senior Research Analyst, Reliance Securities
ADVERTISEMENT
GAIL | Buy | Target price: Rs 342 | Stop loss: Rs 299This stock has found support near its 13-month averages after a sharp fall from the high of Rs 366 over the past few weeks. “As per the set-up, we believe, price-wise and time-wise correction is over and crossover of the short term averages will give a sharp bounce,” Jain said. A positive crossover in RSI and a rise in Stochastic from its oversold zone are indicating a probable turnaround in the stock.
Tata Elxsi | Buy | Target price: Rs 980 | Stop loss: Rs 840
This stock has been trading in the range of Rs 830-890 levels over the past 8 weeks and has completed 61.8 per cent retracement of the entire move from (Rs 511-1,491). The convergence of key technical indicators with recent turnaround is indicating at a bullish trend reversal in the stock. "In case of any decline, recent swing low will work as a key reversal point for the stock," Jain said.
Rajesh Bhosale, Technical Analyst, Angel Broking
Mphasis | Buy | Target price: Rs 1,135 | Stop loss: Rs 933
On the daily chart, the stock has seen a bullish range breakout known as ‘Rectangular Channel’ , after trading in a broad range between Rs 920 and Rs 1,000 levels for last two months. Historically, after witnessing stiff resistance on 200-DMA for five times in last eight months, the prices have closed above the same, confirming a bullish turn around in the trend. The aforesaid breakout was accompanied by a good increase in volume and positive placement of momentum oscillator. "Last week, we witnessed a lot of buzz in the midcap IT space and now with the above breakout, we sense a strong upside in the counter," said Bhosale.
Pfizer | Buy | Target price: Rs 3,590 | Stop loss: Rs 3,220
During the recent turbulence within the pharma space, this stock was a sheer outperformer. It has been continuously forming higher tops and bottoms and after a brief consolidation of three months, a bullish continuation of head and shoulder breakout on the daily chart was witnessed. The said breakout is supported by the price closing above the higher end of the Bollinger band, which signalled a trending upward move after a period of consolidation. Prices are well above major moving averages i.e. 20,50,200D-SMA and momentum oscillators are placed in positive zone, supporting the bullish view on the counter.
Here are some short-term stock recommendations that give decent returns to investors during the Budget week:

Mustafa Nadeem, CEO, Epic Research
NTPC | Buy | Target price: Rs 160 | Stop loss: Rs 134
As per price pattern, NTPC has seen a breakout from an inverted head and shoulder pattern, while at the same time, it has closed above its resistance trendline drawn from peaks of 2017. The volume has seen a jump recently which indicates decisiveness of the trend. There is a positive crossover of 20-day and 50-day SMAs as well. The RSI is touching 70 level, which indicates strength and the stock can move further to higher targets of Rs 160 in the coming days.
Hindustan Zinc | Buy| Target price: Rs 268 | Stop loss: Rs 230
A double bottom has formed on a larger timeframe chart of this stock with prices taking support at the price level last seen in 2017. The RSI has further jumped above 50 after an extended bearish trend and is now indicating at returning strength. The stock on the weekly chart has taken very good support of its 200-day SMA, which may provide short-term relief and a short-term upside that can take prices to Rs 268 in the coming days.
Vaishali Parekh, Senior Technical Analyst at Prabhudas Lilladher
Indraprastha Gas | Buy | Target price: Rs 340 | Stop loss: Rs 306
This stock has witnessed a decent erosion recently and taken support near the Rs 308 level, which is also the trendline support base connecting previous major bottoms. The RSI indicates a trend reversal from near the oversold zone and given a buy signal. “With good volume participation witnessed and the chart looking attractive, we recommend a buy in this stock for an upside target of Rs 340, keeping a stop loss of Rs 306," said Parekh.
Hindustan Unilever (HUL) | Buy | Target price: Rs 1,860 | Stop loss: Rs 1,745
This stock has formed a higher bottom formation pattern on the daily chart, taking support near Rs 1,745 level which is also near the 50DMA. It has currently indicated a bounce back with a positive bias to imply further upward move to retrace the previous peak level. The RSI has indicated a trend reversal to signal a buy. "With good consistent volume participation witnessed, we recommend a buy in this stock for an upside target of Rs 1,860, keeping a stop loss of Rs 1,745," said Parekh.
(Views and recommendations given in this section are the analysts’ own and do not represent those of ETMarkets.com. Please consult your financial adviser before taking any position in the stock/s mentioned.)
Too busy to trade in stocks? Invest in Mutual Funds with ET Money!
Bookmark or read stories offline -
Download ET Markets APP
Download ET Markets APP
ADVERTISEMENT

