Investors can look to accumulate SBI, L&T, ITC, ONGC
Investors can continue adding quality scrips at lower levels.
By ET CONTRIBUTORS | Updated:

Getty Images
By Swapneel Mantri
Technical Analyst, Sushil Finance
Where are We? The week gone by saw the Nifty largely trading in a narrow range on back of a subdued expiry and as investors awaited the G20 summit outcome. The Nifty closed the week at 11,788 — a tad below key levels of 11,800-11,820.
What is in Store? As we head into the Budget week, expect range-bound trade to continue with stock specific actions based on sectoral expectations from the Budget. Levelswise, expect the index to head towards 12,100-12,300 levels on close above 11,820-11,850 levels. On the downside, 11,720-11,650 is a support zone. The 200-DMA for the Nifty is at 11,098.
What could Investors Do? Investors can continue adding quality scrips at lower levels and consolidate the portfolio holdings based on asset allocation and long-term horizon. Sector specific, one can expect action in power, fertilisers, infra, auto and banking scrips. Stock specific, among the front-line counters, investors can look at accumulating SBI, L&T, ITC, ONGC at current levels for short to medium targets of Rs 440, Rs 1,900, Rs 320, Rs 210, respectively. Among metals, Hindalco, Tata Steel can be accumulated at the current levels for higher targets of Rs 240, Rs 560. Among the auto counters, M&M, HeroMoto are looking good for Rs 740 and Rs 3,100 levels.

Indian market last week continued to remain on the edge ahead of Union Budget and a much-awaited meeting between the US President Donald Trump and his Chinese counterpart Xi Jinping. With both the leaders agreeing to a trade truce, progress in monsoon and Budget remain the key factors that will guide Dalal Street this week.
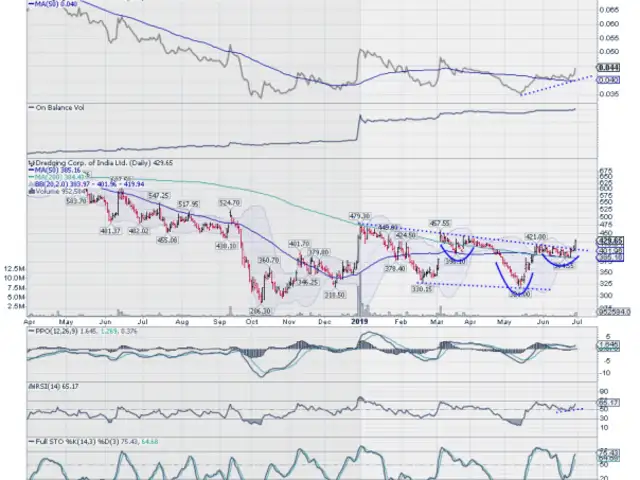
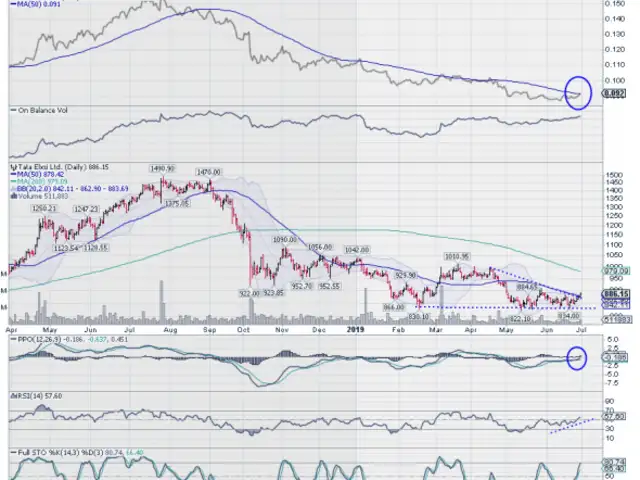
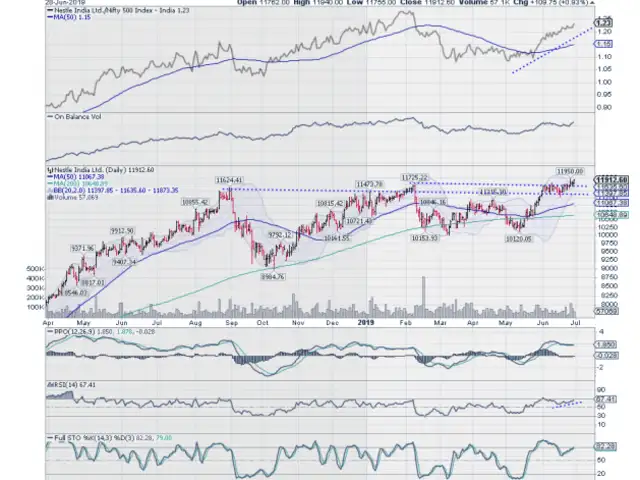
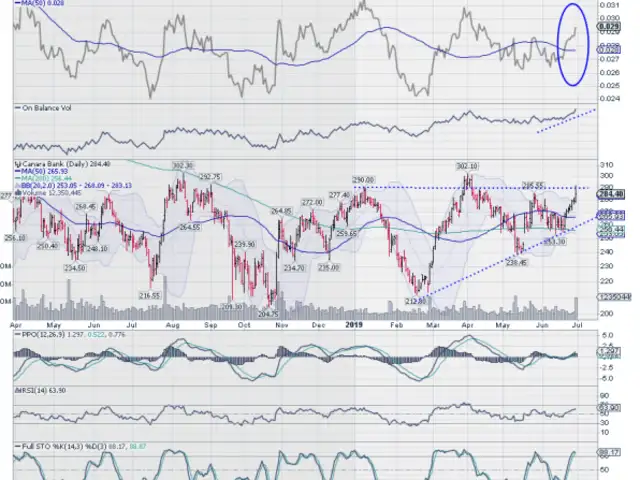
Here are some short-term stock recommendations that give decent returns to investors during the Budget week:
Technical Analyst, Sushil Finance
Where are We? The week gone by saw the Nifty largely trading in a narrow range on back of a subdued expiry and as investors awaited the G20 summit outcome. The Nifty closed the week at 11,788 — a tad below key levels of 11,800-11,820.
What is in Store? As we head into the Budget week, expect range-bound trade to continue with stock specific actions based on sectoral expectations from the Budget. Levelswise, expect the index to head towards 12,100-12,300 levels on close above 11,820-11,850 levels. On the downside, 11,720-11,650 is a support zone. The 200-DMA for the Nifty is at 11,098.
What could Investors Do? Investors can continue adding quality scrips at lower levels and consolidate the portfolio holdings based on asset allocation and long-term horizon. Sector specific, one can expect action in power, fertilisers, infra, auto and banking scrips. Stock specific, among the front-line counters, investors can look at accumulating SBI, L&T, ITC, ONGC at current levels for short to medium targets of Rs 440, Rs 1,900, Rs 320, Rs 210, respectively. Among metals, Hindalco, Tata Steel can be accumulated at the current levels for higher targets of Rs 240, Rs 560. Among the auto counters, M&M, HeroMoto are looking good for Rs 740 and Rs 3,100 levels.
Here are some short-term stock recommendations that give decent returns to investors during the Budget week:

(Disclaimer: The opinions expressed in this column are that of the writer. The facts and opinions expressed here do not reflect the views of www.economictimes.com.)
Too busy to trade in stocks? Invest in Mutual Funds with ET Money!
Bookmark or read stories offline -
Download ET Markets APP
Download ET Markets APP
ADVERTISEMENT

