NDTV shares slip over 6% as CBI raids properties of Roys

On BSE, 90,000 shares have been traded on the counter so far, compared with the average daily volume of 9,064.

NDTV shares slip over 6% as CBI raids properties of Roys
Shares of New Delhi Television (NDTV) slipped as much as 6.74 per cent and hit a fresh 52-week low of Rs 58.10 in morning trade on Monday after a PTI report said the Central Bureau of Investigation (CBI) has carried out searches at the residence of NDTV founder Prannoy Roy in Delhi and in Dehradun for allegedly causing loss to a private bank.

The agency has registered a case against Roy, his wife Radhika and RRPR Holdings for allegedly causing a loss of Rs 48 crore to ICICI Bank, CBI sources said.

The scrip was trading 4.33 per cent down at Rs 59.60 around 11.20 am (IST). Shares of the company opened at Rs 62.55 and touched a high and low of Rs 62.55 and Rs 58.10, respectively, in trade so far.

On BSE, 90,000 shares have been traded on the counter so far, compared with the average daily volume of 9,064 shares traded in last two weeks.

For the latest quarter ended March 31, 2017, NDTV reported a net profit of Rs 5.28 crore against net loss of Rs 0.77 crore reported for the corresponding quarter last year. Net sales of the company declined to Rs 154.35 crore from Rs 169.74 crore reported for the same period.

In last one year, share price of NDTV has plunged nearly 34 per cent to Rs 62.30 till May 2, 2017, whereas BSE Sensex gained 16.50 per cent during the same period.
Top 5 stocks to bet on this week
1/10
The domestic equity market is expected to aim for a fresh high, but analysts say this is the time to approach the market with extreme caution and exploit all the upward moves to protect profits at higher levels.

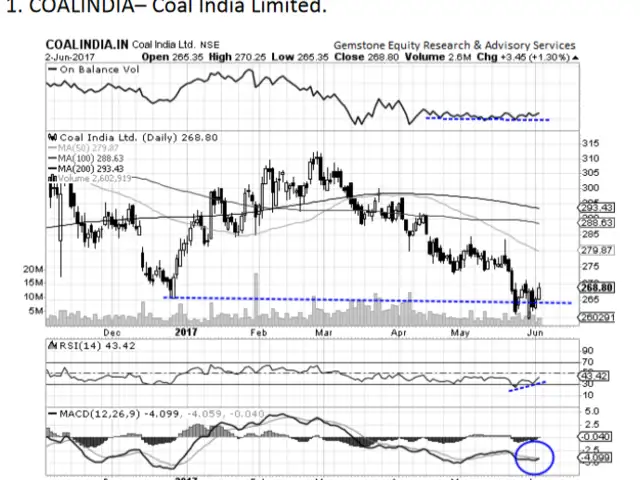
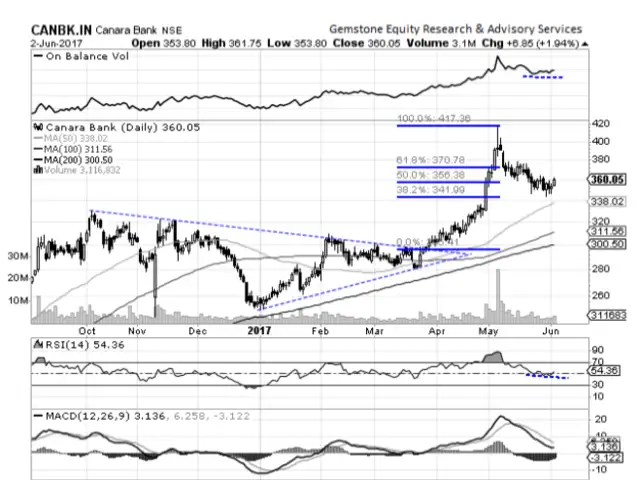
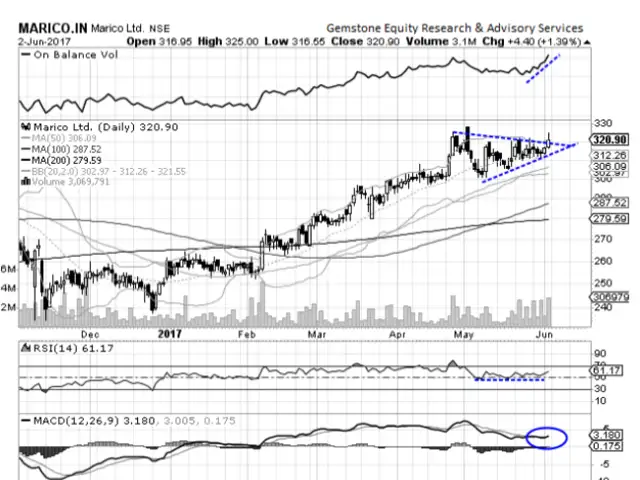
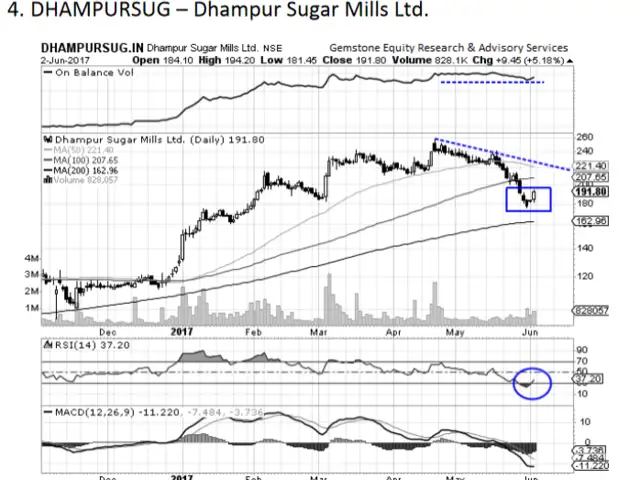
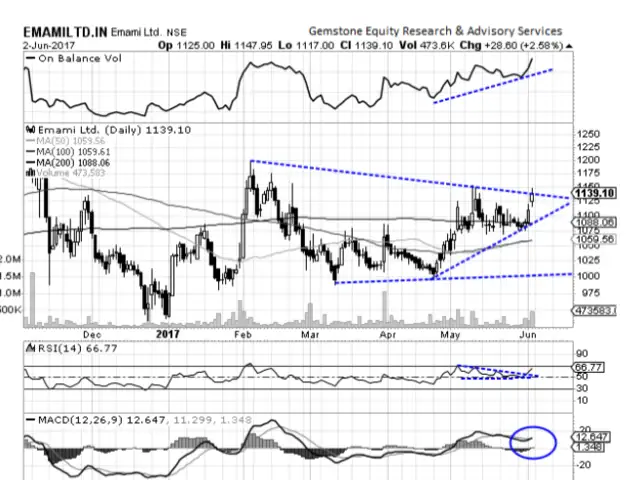
Reading chart patterns, in-house technical analyst Milan Vaishnav listed out the following five stocks as potential buy calls.
The domestic equity market is expected to aim for a fresh high, but analysts say this is the time to approach the market with extreme caution and exploit all the upward moves to protect profits at hi..
Read More
The daily MACD too continues the bullish divergence. The RSI has broken out of a channel and is showing a likely upward revision in price. It also shows a classical positive failure swing on RSI.
After breaking out from a large triangle, the stock some corrective downside after making a high of Rs 416. Canara Bank has completed little more than 50 per cent retracement of its prior bounce and looks towards moving up again. The Stochastic remains in a continuing buy mode.
After breaking out from a large triangle, the stock some corrective downside after making a high of Rs 416. Canara Bank has completed little more than 50 per cent retracement of its prior bounce and ..
Read More
The daily MACD has flattened its trajectory and RSI has shown positive divergence from the price. Emergence of a bullish candle near the support area also increases the chances of a resumption of up move in the price. It remains in leading quadrant against the Bank Nifty on the RRG. The Bank Nifty also remains in a leading quadrant against Nifty on the RRG.
The daily MACD has flattened its trajectory and RSI has shown positive divergence from the price. Emergence of a bullish candle near the support area also increases the chances of a resumption of up ..
Read More
The stock is set for a fresh breakout. After remaining in upward rising channel, the Stock had been consolidating in a symmetrical formation, which is a continuation pattern. The daily MACD has reported a positive crossover and it is now bullish trading above its signal line.
The stock is set for a fresh breakout. After remaining in upward rising channel, the Stock had been consolidating in a symmetrical formation, which is a continuation pattern. The daily MACD has repor..
Read More
The RSI has broken out of a pattern. RSI has also formed a fresh 14-period high, which is a bullish signal. The stock remains a continuous buy on stochastic as well. Importantly, while the stock consolidated, the on balance volume or OBV has already broken out and scaled a high.
The RSI has broken out of a pattern. RSI has also formed a fresh 14-period high, which is a bullish signal. The stock remains a continuous buy on stochastic as well. Importantly, while the stock cons..
Read More
A technical pullback is likely in this stock as the stock is in process of forming a potential short term bottom. A Morning Star pattern has emerged. The emergence of this pattern is important as it has occurred after a downtrend.
A technical pullback is likely in this stock as the stock is in process of forming a potential short term bottom. A Morning Star pattern has emerged. The emergence of this pattern is important as it ..
Read More
The RSI has just move out from a oversold zone, which is a bullish signal. The Stochastic indicators show the emergence of a buy signal against the direction of a major trend. This has bullish implications.
The RSI has just move out from a oversold zone, which is a bullish signal. The Stochastic indicators show the emergence of a buy signal against the direction of a major trend. This has bullish implic..
Read More
Buy this stock above Rs 1,140 with a short-term holding target of Rs 1,220. This stock is set for a fresh breakout. It has been in a large trading range and multiple signals have emerged which point towards fresh upward revision in prices. The on-balance volume has already a fresh high and this is positive.
Buy this stock above Rs 1,140 with a short-term holding target of Rs 1,220. This stock is set for a fresh breakout. It has been in a large trading range and multiple signals have emerged which point ..
Read More
The RSI is has broken out of a pattern and it has marked a 14-period high, which is a bullish sign. The MACD has reported a positive crossover and it now trades above its signal line and it is bullish.
The RSI is has broken out of a pattern and it has marked a 14-period high, which is a bullish sign. The MACD has reported a positive crossover and it now trades above its signal line and it is bullis..
Read More
ADVERTISEMENT
READ MORE

READ MORE:

LOGIN & CLAIM

50 TIMESPOINTS

Related Companies

More from our Partners

Loading next story
Business News › Markets › Stocks › News › NDTV shares slip over 6% as CBI raids properties of Roys
Text Size:AAA
Success
This article has been saved

*

+