NBCC, NTPC, ONGC, HPCL, D-Mart among 100 stocks readying to rally, shows MACD
These stocks have been witnessing strong trading volumes of late.
By ETMarkets.com | Updated:
Getty Images
Analysts see legs to the ongoing Nifty50 rally. It may get extended towards the 11,150-11,250 range in the coming days, said Sameet Chavan at Angel Broking.
NEW DELHI: The momentum in the domestic stock market has changed overnight, after Finance Minister Nirmala Sitharaman delivered the much-anticipated booster package and RBI’s board approved the Jalan Committee report on transfer of the central bank’s excess reserve to the government.
US President Donald Trump’s optimistic tone on ‘genuine’ trade deal efforts from China also helped lift the sentiment.
Along with these fundamental changes, the outlook has turned bullish for over 100 largecap and midcap stocks on the technical charts.
And the moving average convergence divergence, or MACD, suggests these stocks look set to head higher in the coming days.
The momentum indicator signalled a bullish crossover on these counters, hinting at possible upsides. These stocks have been witnessing strong trading volumes of late, lending further credence to the emerging trend.
The list included Dish TV, Indiabulls Housing Finance, Jindal Streel & Power, IDBI Bank and NBCC.
ADVERTISEMENT
NTPC, Britannia, Canara Bank, ONGC, HPCL, Adani Ports, Larsen & Toubro, Bajaj Finance, Jubilant Foodworks, Grasim, D-Mart and Sun TV are among other stocks forming similar bullish crossovers on the daily scale.
The MACD is known for signalling trend reversals in traded securities or indices. It is the difference between the 26-day and 12-day exponential moving averages. A nine-day exponential moving average, called the signal line, is plotted on top of the MACD to reflect ‘buy’ or ‘sell’ opportunities.
ADVERTISEMENT
When the MACD crosses above the signal line, it gives a bullish signal, indicating that the price of the security may see an upward movement and vice versa.
Meanwhile, 22 stocks are signalling bearish trends. They included SBI Life Insurance, Opto Circuits, AU Small Finance Bank, Everest Kanto, Alembic, Mahindra Holidays and ARSS Infrastructure.
ADVERTISEMENT
Analysts said the MACD indicator should not be seen in isolation, as it may not be sufficient to take a trading call, just the way a fundamental analyst cannot give a ‘buy’ or ‘sell’ recommendation using a single valuation ratio.
Analysts see further legs to the ongoing Nifty50 rally. It may get extended towards the 11,150-11,250 range in the coming days, said Sameet Chavan at Angel Broking.
“Traders are advised not to take any contrarian bet and instead use dips to go long. Ideally, one should adopt a stock-specific approach. For Nifty, immediate support should come in at 11,000 followed by 10,930 levels,” Chavan said.
Understanding MACD
A close look at the stock chart of IDBI Bank shows whenever the MACD line has breached above the signal line, the stock has shown an upward momentum and vice versa. On Tuesday, the scrip traded 0.89 per cent higher at Rs 28.30 on NSE.
Top technical stock recommendations for this week
1/6
Technical indicators show the market may make see some half-hearted bounce and attempt to stabilise and defend its most recent bottom. But the same may not sustain. The broader market setup remains structurally bearish. Here are four stocks that look like potential buys for this week.
Technical indicators show the market may make see some half-hearted bounce and attempt to stabilise and defend its most recent bottom. But the same may not sustain. The broader market setup remains s..
Read More
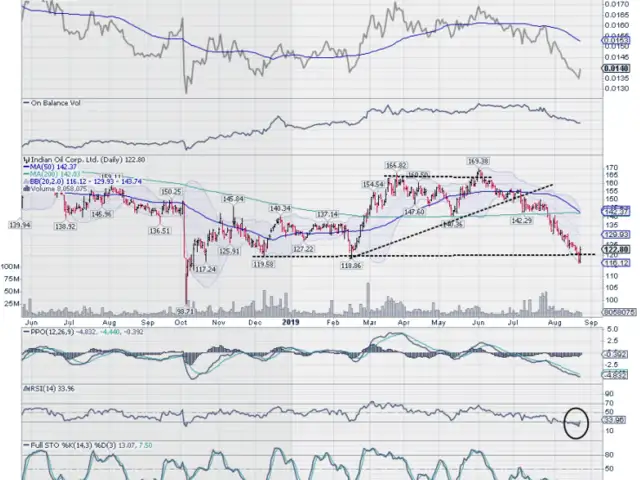
The stock is set for a probable technical bounce back. After failing to break above 160-165 range, the stock saw a prolonged steady decline and has attempted to form a base in the 115-120 zones. The price has tested a 9-month extended trend line support and has crawled back above it after a minor violation. The stock got oversold, and the RSI has moved above 30 from the oversold area which shows a
potential formation of a bottom. An engulfing bullish candle emerged. It may make a case for a technical pullback as it appeared near the key support point adding to the credibility of the support zone. Any close below 115 will be a stop-loss for this trade.
The stock is set for a probable technical bounce back. After failing to break above 160-165 range, the stock saw a prolonged steady decline and has attempted to form a base in the 115-120 zones. The ..
Read More
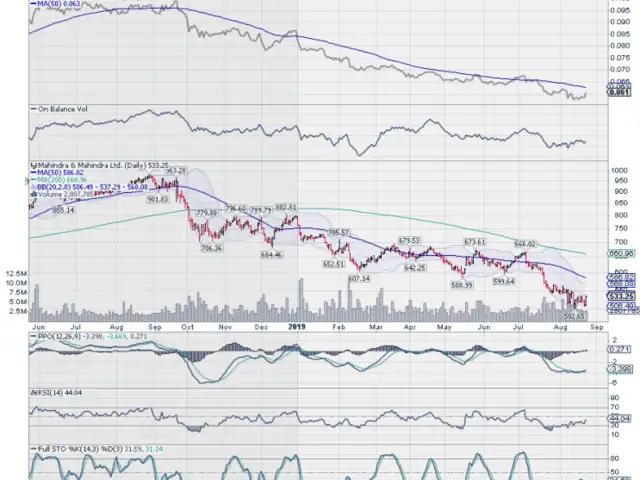
This auto stock has remained in a sustained downtrend for almost a year after marking highs just below the 1000-mark. Over past couple of trading sessions, it has created a congestion zone in the 505-530 range in an attempt to market a temporary bottom for itself. The daily MACD has shown a positive crossover, and it is bullish as it trades above its signal line. The PPO has turned positive. A clear bullish divergence by RSI is seen as while the stock consolidated, the RSI marked higher bottoms and formed a 14-period high. Some short term momentum in the stock cannot be ruled out. Any close below 505 will be a stop loss for this trade.
This auto stock has remained in a sustained downtrend for almost a year after marking highs just below the 1000-mark. Over past couple of trading sessions, it has created a congestion zone in the 505..
Read More
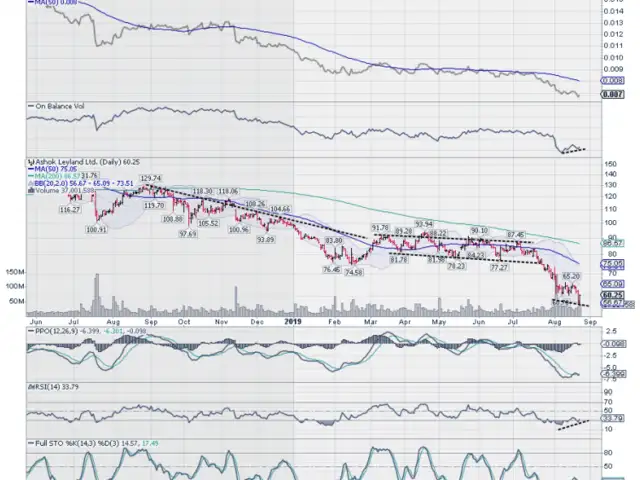
The stock has underperformed the broader markets in the last 12-14 months' time frame. Presently, after testing a low near 56, the stock pulled back on higher volumes. An attempt to form a potential
bottom is seen in the 56-60 zone. A piercing line has emerged on the candles. This potentially marks a temporary base. While the stock declined, the OBV—On Balance Volume stayed steady and even inched higher. The RSI has just crossed above 30 after trading in the oversold territory. A bullish divergence is observed on the RSI as while the stock marked a lower low, the RSI formed higher low and moved higher. A temporary pullback cannot be ruled out in the stock. Any close below 56 will be a stop loss in this trade.
The stock has underperformed the broader markets in the last 12-14 months' time frame. Presently, after testing a low near 56, the stock pulled back on higher volumes. An attempt to form a potential
..
Read More
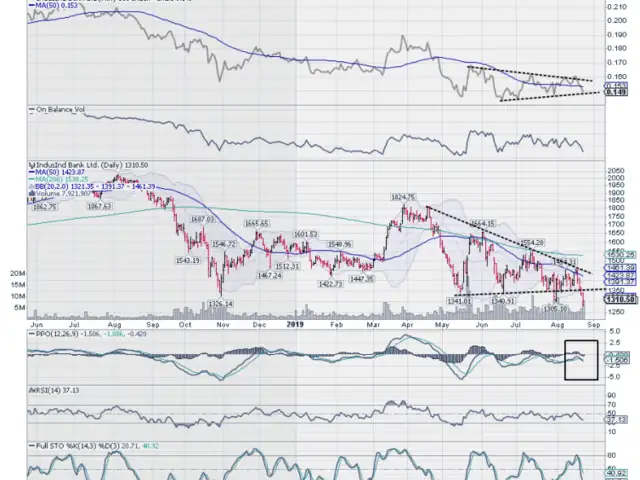
The stock failed to clear the 1820-1824 range and saw a sharp corrective decline taking near to 1340 levels. Since then, the price action in the stock has formed a classical Descending Triangle Pattern which is primarily bearish. The price has shown a break down from this formation. The downside breach was accompanied with higher-than-average volumes which act as a confirmation of the direction of the move. The MACD has shown a negative crossover, and it is now bearish while trading below its signal line. The PPO has turned negative. Though minor
pullbacks cannot be ruled out, the primary trend in the stock has become bearish. The RS line, when compared with the broader market is moving down and has crossed under the 50-DMA. Any close above 1355 will be a stop loss for this trade.
The stock failed to clear the 1820-1824 range and saw a sharp corrective decline taking near to 1340 levels. Since then, the price action in the stock has formed a classical Descending Triangle Patte..
Read More
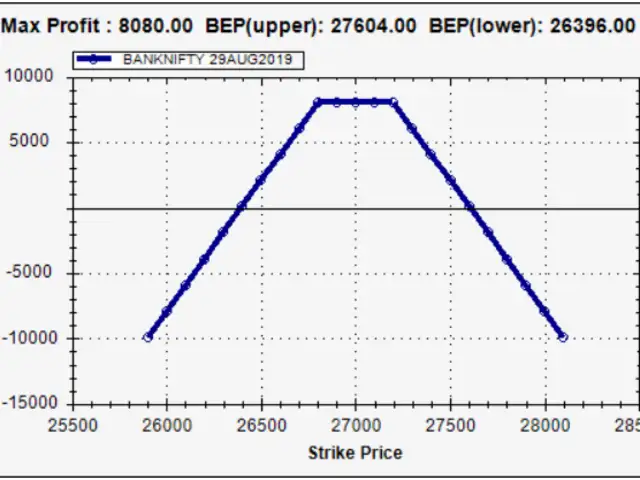
Given the options data as of Friday Close for the August 29, 2019 expiry, the is expected to trade in a broad range and might even stay volatile while the general markets attempts to deal with the negative global setup and some positive domestic newsflow.
Sell BANKNIFTY 29AUG 26800 CALL at 422 and Sell BANKNIFTY 29AUG 27200 PUT at 382. Receive -Net Premium of Rs. 16080. Maximum Potential Profit of Rs. 8080. The call shall remain profitable ABOVE 26396 and BELOW 27604.
(IMPORTANT: The Option Prices shown are as of Friday’s Close. The Pay-off Chart, Maximum Loss and Maximum Profit Potential can vary as per the actual execution price)
* Disclosure under Clause 19 of SEBI (Research Analysts) Regulations 2014: Analyst, Family Members or his Associates holds no financial interest below 1% or higher than 1% and has not received any compensation from the Companies discussed.
Given the options data as of Friday Close for the August 29, 2019 expiry, the is expected to trade in a broad range and might even stay volatile while the general markets attempts to deal with the ne..