12 money-making ideas that can deliver solid returns in 4 weeks
The government on Friday rolled back a tax surcharge on overseas portfolio investors.
By ETMarkets.com | Updated:

Getty Images
Domestic equity indices kicked off the week on an optimistic note on Monday after Finance Ministry’s Friday announcements helped improve sentiments.
The 50-share NSE Nifty rallied over 200 points in early trade but gave up the gains within an hour to trade flat. Sensex was up 40 points at 36,741 at 10.30 am (IST).
The government on Friday rolled back a tax surcharge on overseas portfolio investors and announced a slew to sector-specific measures, trying to pump-prime the economy.
Jay Thakkar, CMT-Head Technical and Derivatives Research, AVP Equity Research, Anand Rathi Shares and Stock Brokers said Nifty’s daily MACD is in buy mode. “Hence, there is a positive divergence for the index on the daily chart, indicating the possibility of a sustained short-covering rally for a few days. On the lower side, 10,637 and 10,550 levels would be immediate supports while the immediate resistance is at 10,900. Above 10,900, Nifty can zoom towards 11,100 level,” he said.
Based on various brokerage recommendations, here are 12 stock strategies that can potentially deliver solid gains over the next 11-21 sessions.
Milan Vaishnav, CMT, MSTA, Consulting Technical Analyst, Gemstone Equity Research and Advisory
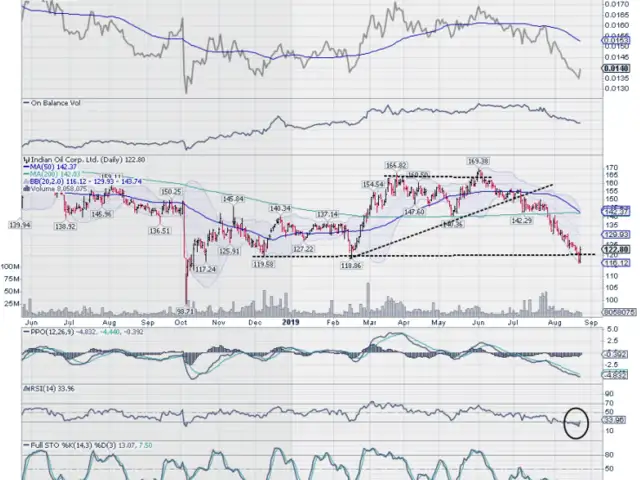
IndianOil | Buy | Target price: Rs 135 | Stop loss: Rs 115
The stock is set for a probable technical bounceback. After failing to break above the Rs 160-165 range, this stock saw a steady decline and attempted to form a base in the Rs 115-120 zone. The stock has tested a nine-month extended trend line support and crawled back above it after a minor violation. The stock is oversold, and the RSI has moved above 30 from the oversold area, which shows a potential bottom formation. An engulfing bullish candle has emerged on the charts and it may make the case for a technical pullback as it appeared near the key support, adding credibility to the support zone. Any close below Rs 115 will be a stop loss for this trade.
Sameet Chavan, Chief Analyst- Technical & Derivatives, Angel Broking
Tata Elxsi |Buy | Target price: Rs 685 | Stop loss: Rs 631
The stock consolidated for nearly three weeks after taking a strong knock of more than 30 per cent in the first half of July. On Friday, the market witnessed strong buying at lower levels, which accelerated a bullish breakout from the recent congestion zone on the counter. The kind of volume activity witnessed during this intraday surge was quite encouraging and added credence to the move. Going ahead, Angel Broking expects a decent relief rally on this counter. One can buy this stock for a target of Rs 685 over the next few days. The stop loss should be fixed at Rs 631.
Bharat Electronics | Buy | Target price: Rs 111 | Stop loss: Rs 92.40
On the daily chart, this stock has traded between two crucial moving averages for last one month with the 200-SMA acting as a strong base and 100-EMA acting as a stiff resistance. Now, the price has broken out of this range on the higher side by closing above the 100-EMA. The said breakout is supported by sizable volumes and a strong bullish candle. In addition, momentum oscillator RSI has entered the positive zone above 50, supporting the optimistic stance. “Going with all the above evidence we recommend buying this stock at current levels for a target of Rs 111 over the next few days. The stop loss can be placed at Rs 92.40,” the analyst said.
Axis Bank | Buy | Target price: Rs 720 | Stop loss: Rs 642
After three weeks of price action, this stock is looking quite interesting on the weekly charts with a Hammer kind of formation, as this counter bounced back from around Rs 645 level, suggesting some accumulation. Hence, sustaining above Rs 643 level, this counter can eventually head to much higher levels. “Positional traders should take this opportunity and buy into this counter for a target of Rs 720 with a stop loss of Rs 642,” the analyst said.
Britannia Industries | Buy | Target price: Rs 2640 | Stop loss: Rs 2,390
The price action of the last two trading sessions, with solid bullish candles, is looking interesting on this counter as it remained resilient during the violent downswing seen in last two sessions. This kind of price behaviour is clearly hinting at some sort of accumulation and near-term bottom around those levels. “Positional traders should buy into this counter with a stop below Rs 2,390 level on a closing basis and look for a target of Rs 2,640,” the brokerage said.
Vikas Jain, Senior Research Analyst, Reliance Securities
GAIL | Buy | Target price: Rs 145 | Stop loss: Rs 115
The stock has made a double bottom near Rs 120 and witnessed a sharp bounce from this level with positive momentum in last one month. A convergence in RSI is signalling an overall positive trend, and oversold stochastic is indicating limited downside for the stock. The stock has closed near to its short-term averages, confirming the uptrend to test the medium-term average of Rs 145 in next few weeks. Long positions can be initiated for a target of Rs 145 with a stop loss of Rs 115.
L&T | Buy | Target price: Rs 1,520| Stop loss: Rs 1,210
This stock has multi-month support near to its 34-month average and it has always witnessed a strong move from those levels to reinforce a positive stance. On the higher side, the stock will face a minor hurdle around Rs 1,390, which coincides with the long-term average on the daily charts and a crossover of the same would give a breakout. However, in case of any decline, its lower band of the falling channel near Rs 1,200 level will work as key reversal point. Long position can be initiated for the target of Rs 1,520 with a stop loss of Rs 1,210.
Jay Thakkar, CMT–Head Technical and Derivatives Research - AVP Equity Research, Anand Rathi Shares and Stock Brokers
HUL | Buy | Target price: Rs 1940 | Stop loss Rs 1,820
This stock has seen a breakout from the rectangular pattern on the daily charts with a clear buy crossover in its momentum indicator MACD. Buy this stock for the target of Rs 1,940.
NIIT Technologies | Buy | Target price: Rs 1,440 | Stop Loss: Rs 1,335
The stock has seen a breakout from the expanding triangular pattern which is a continuation pattern. The Index seems to have started wave III of wave 5 up with the momentum indicators absolutely in buy mode, hence one can buy this stock for the target of Rs 1,440.
Nandish Shah, Senior Technical Analyst, HDFC Securities
Escorts | Buy | Target price: Rs 490 | Stop loss: Rs 432
This stock has formed a bullish engulfing pattern on the daily chart. Moreover, it closed above its five-day SMA with higher volumes. The RSI oscillator has formed a positive divergence on the daily chart. “In the derivative segment, we have seen long build up in the Escorts futures. Therefore, we recommend buying at current market price of Rs 453 and add more on dips around Rs 445 for the upside target of Rs 490, keeping a stop loss of Rs 432 level,” said Shah.
Shrikant Chauhan, Head of Technicals, Kotak Securities
SBI | Buy | Target: Rs 288 | Stop loss: Rs 262
The weekly RSI (momentum oscillator) is currently at 35 and provides an opportunity for traders, who missed the bus earlier. It also usually leads to a dead-cat bounce and provides opportunity for quick returns.
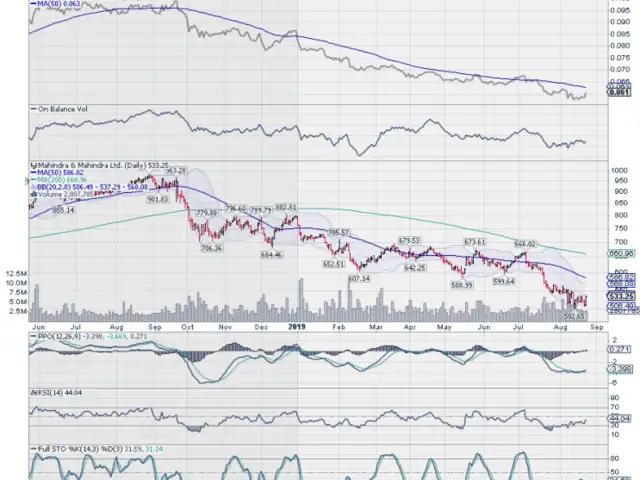
M&M | Target price: Rs 565 | Stop loss: Rs 520
This stock is diverging positively on a daily basis, which is an indication of a shift or pause in the prevailing trend, which is downward. The stock has also formed double/higher bottom at Rs 509 against Rs 502.55 and is available to buy at multi-year lows.
(Views and recommendations given in this section are the analysts’ own and do not represent those of ETMarkets.com. Please consult your financial adviser before taking any position in the stock/s mentioned.)

The 50-share NSE Nifty rallied over 200 points in early trade but gave up the gains within an hour to trade flat. Sensex was up 40 points at 36,741 at 10.30 am (IST).
The government on Friday rolled back a tax surcharge on overseas portfolio investors and announced a slew to sector-specific measures, trying to pump-prime the economy.
Jay Thakkar, CMT-Head Technical and Derivatives Research, AVP Equity Research, Anand Rathi Shares and Stock Brokers said Nifty’s daily MACD is in buy mode. “Hence, there is a positive divergence for the index on the daily chart, indicating the possibility of a sustained short-covering rally for a few days. On the lower side, 10,637 and 10,550 levels would be immediate supports while the immediate resistance is at 10,900. Above 10,900, Nifty can zoom towards 11,100 level,” he said.
Based on various brokerage recommendations, here are 12 stock strategies that can potentially deliver solid gains over the next 11-21 sessions.
Milan Vaishnav, CMT, MSTA, Consulting Technical Analyst, Gemstone Equity Research and Advisory
ADVERTISEMENT
IndianOil | Buy | Target price: Rs 135 | Stop loss: Rs 115
The stock is set for a probable technical bounceback. After failing to break above the Rs 160-165 range, this stock saw a steady decline and attempted to form a base in the Rs 115-120 zone. The stock has tested a nine-month extended trend line support and crawled back above it after a minor violation. The stock is oversold, and the RSI has moved above 30 from the oversold area, which shows a potential bottom formation. An engulfing bullish candle has emerged on the charts and it may make the case for a technical pullback as it appeared near the key support, adding credibility to the support zone. Any close below Rs 115 will be a stop loss for this trade.
Sameet Chavan, Chief Analyst- Technical & Derivatives, Angel Broking
Tata Elxsi |Buy | Target price: Rs 685 | Stop loss: Rs 631
The stock consolidated for nearly three weeks after taking a strong knock of more than 30 per cent in the first half of July. On Friday, the market witnessed strong buying at lower levels, which accelerated a bullish breakout from the recent congestion zone on the counter. The kind of volume activity witnessed during this intraday surge was quite encouraging and added credence to the move. Going ahead, Angel Broking expects a decent relief rally on this counter. One can buy this stock for a target of Rs 685 over the next few days. The stop loss should be fixed at Rs 631.
ADVERTISEMENT
Bharat Electronics | Buy | Target price: Rs 111 | Stop loss: Rs 92.40
On the daily chart, this stock has traded between two crucial moving averages for last one month with the 200-SMA acting as a strong base and 100-EMA acting as a stiff resistance. Now, the price has broken out of this range on the higher side by closing above the 100-EMA. The said breakout is supported by sizable volumes and a strong bullish candle. In addition, momentum oscillator RSI has entered the positive zone above 50, supporting the optimistic stance. “Going with all the above evidence we recommend buying this stock at current levels for a target of Rs 111 over the next few days. The stop loss can be placed at Rs 92.40,” the analyst said.
ADVERTISEMENT
Mazhar Mohammad, Chief Strategist – Technical Research & Trading Advisory, ChartviewindiaAxis Bank | Buy | Target price: Rs 720 | Stop loss: Rs 642
After three weeks of price action, this stock is looking quite interesting on the weekly charts with a Hammer kind of formation, as this counter bounced back from around Rs 645 level, suggesting some accumulation. Hence, sustaining above Rs 643 level, this counter can eventually head to much higher levels. “Positional traders should take this opportunity and buy into this counter for a target of Rs 720 with a stop loss of Rs 642,” the analyst said.
Britannia Industries | Buy | Target price: Rs 2640 | Stop loss: Rs 2,390
The price action of the last two trading sessions, with solid bullish candles, is looking interesting on this counter as it remained resilient during the violent downswing seen in last two sessions. This kind of price behaviour is clearly hinting at some sort of accumulation and near-term bottom around those levels. “Positional traders should buy into this counter with a stop below Rs 2,390 level on a closing basis and look for a target of Rs 2,640,” the brokerage said.
Vikas Jain, Senior Research Analyst, Reliance Securities
GAIL | Buy | Target price: Rs 145 | Stop loss: Rs 115
The stock has made a double bottom near Rs 120 and witnessed a sharp bounce from this level with positive momentum in last one month. A convergence in RSI is signalling an overall positive trend, and oversold stochastic is indicating limited downside for the stock. The stock has closed near to its short-term averages, confirming the uptrend to test the medium-term average of Rs 145 in next few weeks. Long positions can be initiated for a target of Rs 145 with a stop loss of Rs 115.
L&T | Buy | Target price: Rs 1,520| Stop loss: Rs 1,210
This stock has multi-month support near to its 34-month average and it has always witnessed a strong move from those levels to reinforce a positive stance. On the higher side, the stock will face a minor hurdle around Rs 1,390, which coincides with the long-term average on the daily charts and a crossover of the same would give a breakout. However, in case of any decline, its lower band of the falling channel near Rs 1,200 level will work as key reversal point. Long position can be initiated for the target of Rs 1,520 with a stop loss of Rs 1,210.
Jay Thakkar, CMT–Head Technical and Derivatives Research - AVP Equity Research, Anand Rathi Shares and Stock Brokers
HUL | Buy | Target price: Rs 1940 | Stop loss Rs 1,820
This stock has seen a breakout from the rectangular pattern on the daily charts with a clear buy crossover in its momentum indicator MACD. Buy this stock for the target of Rs 1,940.
NIIT Technologies | Buy | Target price: Rs 1,440 | Stop Loss: Rs 1,335
The stock has seen a breakout from the expanding triangular pattern which is a continuation pattern. The Index seems to have started wave III of wave 5 up with the momentum indicators absolutely in buy mode, hence one can buy this stock for the target of Rs 1,440.
Nandish Shah, Senior Technical Analyst, HDFC Securities
Escorts | Buy | Target price: Rs 490 | Stop loss: Rs 432
This stock has formed a bullish engulfing pattern on the daily chart. Moreover, it closed above its five-day SMA with higher volumes. The RSI oscillator has formed a positive divergence on the daily chart. “In the derivative segment, we have seen long build up in the Escorts futures. Therefore, we recommend buying at current market price of Rs 453 and add more on dips around Rs 445 for the upside target of Rs 490, keeping a stop loss of Rs 432 level,” said Shah.
Shrikant Chauhan, Head of Technicals, Kotak Securities
SBI | Buy | Target: Rs 288 | Stop loss: Rs 262
The weekly RSI (momentum oscillator) is currently at 35 and provides an opportunity for traders, who missed the bus earlier. It also usually leads to a dead-cat bounce and provides opportunity for quick returns.
M&M | Target price: Rs 565 | Stop loss: Rs 520
This stock is diverging positively on a daily basis, which is an indication of a shift or pause in the prevailing trend, which is downward. The stock has also formed double/higher bottom at Rs 509 against Rs 502.55 and is available to buy at multi-year lows.
(Views and recommendations given in this section are the analysts’ own and do not represent those of ETMarkets.com. Please consult your financial adviser before taking any position in the stock/s mentioned.)
Technical indicators show the market may make see some half-hearted bounce and attempt to stabilise and defend its most recent bottom. But the same may not sustain. The broader market setup remains structurally bearish. Here are four stocks that look like potential buys for this week.

Too busy to trade in stocks? Invest in Mutual Funds with ET Money!
Bookmark or read stories offline -
Download ET Markets APP
Download ET Markets APP
ADVERTISEMENT

