Aurobindo, NCC, RInfra, UltraTech among 46 stocks signalling downsides on MACD
These stocks have been witnessing strong trading volumes of late.
By ETMarkets.com | Updated:
ThinkStock Photos
The momentum indicator signalled a bearish crossover – a sign of bearish undertone – on 46 counters, hinting at possible downsides.
NEW DELHI: As the Nifty50 rules at all-time high, market breadth remains tepid, raising questions over the sustainability of the recent bounce.
More and more midcap and smallcap stocks are signalling bearish trends than the ones sending out bullish signals, suggests MACD, or moving average convergence divergence.
The momentum indicator signalled a bearish crossover – a sign of bearish undertone – on 46 counters, hinting at possible downsides.
These stocks have been witnessing strong trading volumes of late, lending credence to the emerging trend.
Mastek, Ujaas Energy, IPCA Labs, Parag Milk Foods, Man Industries, Simplex Infra, Minda Industries, Aarti Drugs and Gallant Ispat are a few other companies on the list.
ADVERTISEMENT
The MACD is known for signalling trend reversals in traded securities or indices. It is the difference between the 26-day and 12-day exponential moving averages.
A nine-day exponential moving average, called the signal line, is plotted on top of the MACD to reflect ‘buy’ or ‘sell’ opportunities.
ADVERTISEMENT
When the MACD crosses above the signal line, it gives a bullish signal, indicating that the price of the security may see an upward movement and vice versa.
Meanwhile, 10 stocks are showing bullish trends on NSE. The list included Havells India, Ajanta Pharma, Orient Refectories, Hatsun Agro and recently listed Chalet Hotels.
ADVERTISEMENT
The MACD indicator should not be seen in isolation, as it may not be sufficient to take a trading call, just the way a fundamental analyst cannot give a 'buy' or 'sell' recommendation using a single valuation ratio.
Traders should make use of other indicators such as Relative Strength Index (RSI), Bollinger Bands, Fibonacci Series, candlestick patterns and Stochastic to confirm an emerging trend.
As for Nifty50, analysts maintain a positive stance, but believe weak market breadth could be a worry. Besides, some momentum oscillators suggest the stocks have become oversold.
“The current chart pattern signals the possibility of a breakout of a recent upward range movement. But the overall market breadth was not impressive on Monday, with midcaps and smallcaps rising only marginally. The next upside range to watch out for is at 12,150-12,180,” said Nagaraj Shetti of HDFC Securities.
Sameet Chavan of Angel Broking expects ‘gravity defying’ moves in coming days despite some of the momentum oscillators being in the overbought territories.
Top technical stock picks that can deliver good returns in the short term
1/6
Market euphoria made indices reach new all-time highs in yet another eventful week. The Indian equity market keenly watched the general elections outcome and portfolio allocation of Modi's new team in the second innings. As the market looks bullish, Milan Vaishnav picked the following stocks based on their technical charts which can potentially help investors make the most of the market rally.
Market euphoria made indices reach new all-time highs in yet another eventful week. The Indian equity market keenly watched the general elections outcome and portfolio allocation of Modi's new team i..
Read More
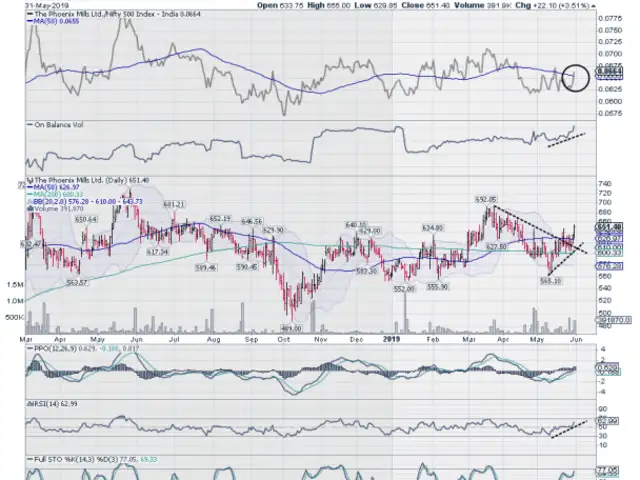
The Realty pack has remained resilient in recent times, and this stock is one among such stocks which are little affected by the volatility in the broader markets. After witnessing a corrective move from the 692 levels, the stock has pulled back, and it has moved past the 200-DMA and 50-DMA levels. The OBV-On Balance Volume has formed a fresh high which acts as confirmation on the volume front while the stocks attempt to resume its up move. The RS Line, when compared against the broader markets, has changed its territory and has penetrated its 20-DMA. RSI too is seen breaking out of a formation. RSI is bullish as it has marked a fresh 14-period high. Any move below 620 will be negative for the stock.
The Realty pack has remained resilient in recent times, and this stock is one among such stocks which are little affected by the volatility in the broader markets. After witnessing a corrective move ..
Read More
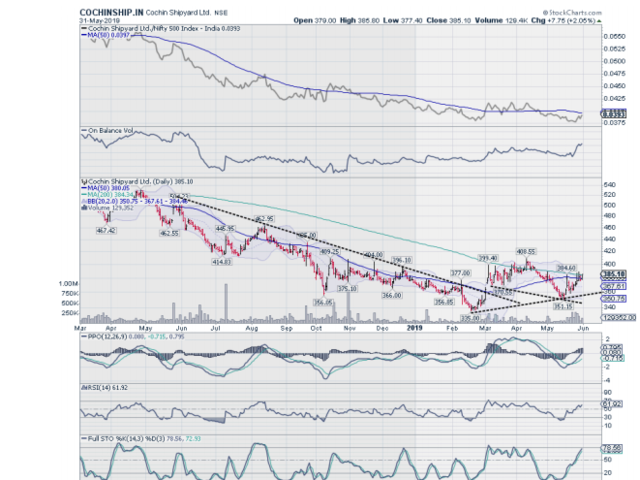
Some fresh signs of a possible up move appear on this stock. After a prolonged multi-month downtrend, the stock has attempted for form, and subsequently confirm a reversal. The daily MACD is in continuing buy mode. While the price is consolidating, the OBV – On Balance Volume has given a fresh high, which is a bullish sign. The price has ended above its 200-DMA. The stock has also ended above the upper Bollinger band, and this further increases the possibility of a breakout and prices moving higher. Any move below 365 will be negative for the stock.
Some fresh signs of a possible up move appear on this stock. After a prolonged multi-month downtrend, the stock has attempted for form, and subsequently confirm a reversal. The daily MACD is in conti..
Read More
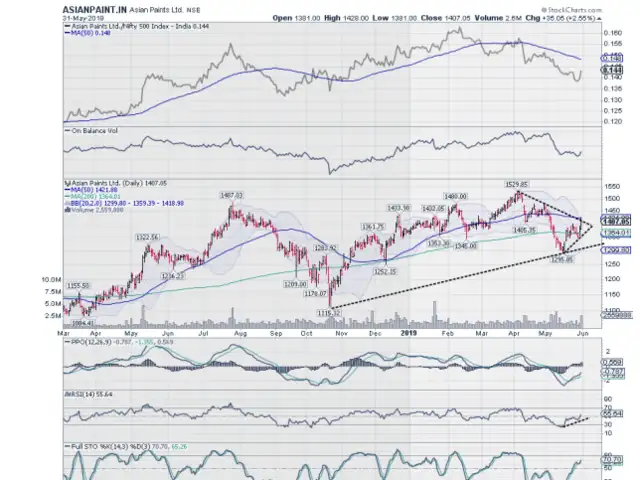
After a recent underperformance, the stock has taken support at a multi-month trend line support in the 1295-1310 zone. After pulling back from these levels and after some brief consolidation, the stock is likely to resume its up move. The daily MACD remains in continuing buy mode. The RSI has marked a fresh 14-period high and also shows bullish divergence against the price. A new buy signal has emerged on the weekly Stochastic. The drastic fall in the Crude price recently is likely to aid the possible up move of this otherwise technically stable stock. Any move below 1275 will be negative for the stock.
After a recent underperformance, the stock has taken support at a multi-month trend line support in the 1295-1310 zone. After pulling back from these levels and after some brief consolidation, the st..
Read More
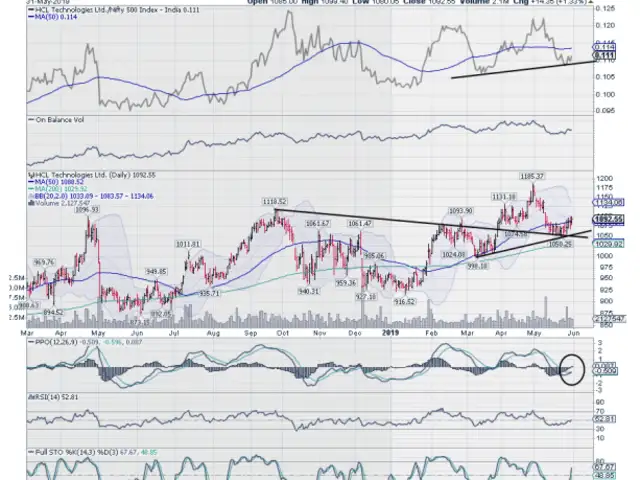
The stock saw some corrective moves over the past several weeks while the IT pack under-performed the broader markets. The stock has found support at the confluence area of the two trend lines in the 1050-1065 zone. The daily MACD has shown a positive crossover, and it is now bullish while trading above its signal line. The RSI is in neutral not showing any divergence against the price. On the weekly chart, the price remains in a firm uptrend and the OBV – On Balance Volume has marked a fresh high. A price target of 1140 can be expected. Any move below 1065 will be negative for the stock.
The stock saw some corrective moves over the past several weeks while the IT pack under-performed the broader markets. The stock has found support at the confluence area of the two trend lines in the..
Read More
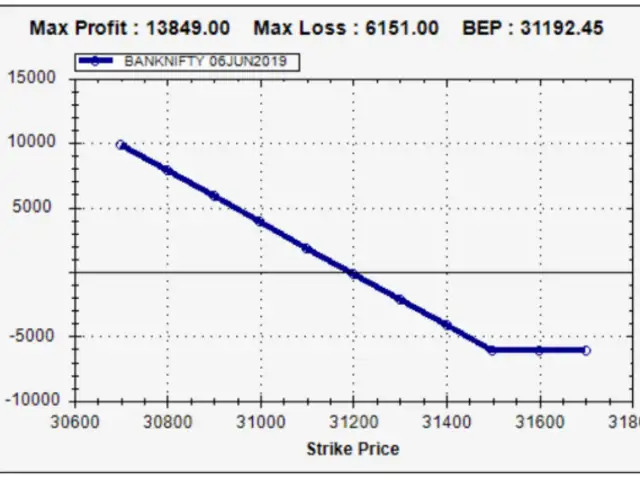
Following resilient performance over past many weeks, the Bank Nifty Index has shown some signs of fatigue. It has formed a Hanging Man pattern and this can potentially stall its move as this pattern has appeared following a steep uptrend. Though this requires conformation going ahead, the options data suggests that the upside in Nifty Bank Index may stay limited.
(IMPORTANT: The Option Prices shown are as at Friday’s Close. The Pay-off Chart, Maximum Loss and Maximum Profit Potential can vary as per the actual execution price)
(Disclaimer: The opinions expressed in this column are that of the writer. The facts and opinions expressed here do not reflect the views of www.economictimes.com.)
Following resilient performance over past many weeks, the Bank Nifty Index has shown some signs of fatigue. It has formed a Hanging Man pattern and this can potentially stall its move as this pattern..
“Mind you, we may not see immediate declines in the market amid such strong trends. Hence, it’s better not to be sceptical about the recent upward move and keep participating in this rally by following a stock-centric approach,” he said.
Understanding MACD A close look at the stock chart of Aurobindo Pharma shows whenever the MACD line has breached below the signal line, the stock has shown an upward momentum and vice versa.
On Tuesday, the scrip traded at Rs 653.80, down 0.46 per cent on NSE.