HCL Tech, Lupin, Havells among 11 stocks that analysts say can give solid returns in 2-3 weeks
Analysts said one must execute trades with caution in this market.
By Nishant Kumar, ETMarkets.com | Updated:

ThinkStock Photos
NEW DELHI: Despite weak global cues, domestic benchmark indices got off to a positive start on Monday as ease in crude oil prices globally further boosted hopes of a policy rate cut by the RBI in its policy review later this week.
The upside in the market though remained capped as macro data including a 5-year low GDP and weak auto sales numbers suggested that the domestic economy might not be immune to the global slowdown.
Analysts said one must execute trades with caution. Based on their recommendations, below are 11 stocks that look poised to give solid returns in 2-3 weeks:
Mazhar Mohammad, Chief Strategist – Technical Research & Trading Advisory, Chartviewindia.in
Bata India | Buy | Target price: Rs 1,397 | Stop loss: Rs 1,306
The stock appears to be stabilising after the recent correction. It has closed in the black for three consecutive sessions now. The price action has been flat around Rs 1,320, hinting at accumulation around the level. If the scrip sustains above the recent low of Rs 1,307, the counter may ideally head towards its interim top placed around Rs 1,400.
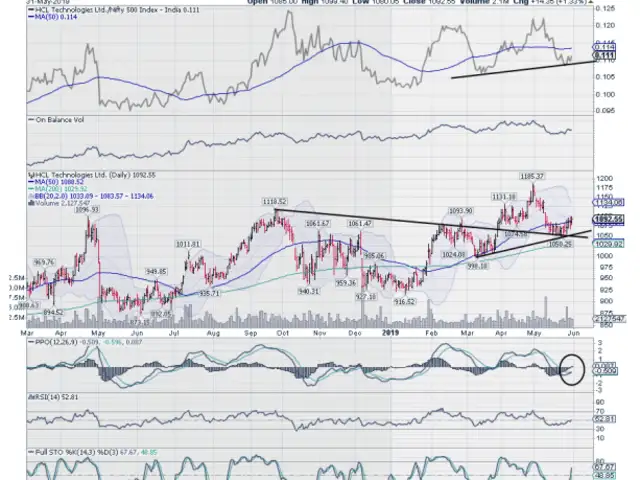
HCL Technologies | Buy | Target price: 1,150 | Stop loss: Rs 1,049
Vaishali Parekh, senior technical analyst at Prabhudas Lilladher
Godrej Consumer Products | Buy | Target price: Rs 735 | Stop loss: Rs 650
The stock formed a bullish candle pattern on the daily. It breached its 50-day moving average to give a breakout above Rs 680. It was proving as a key resistance level during the consolidation phase. The scrip has potential to rise further in the coming days. The RSI also has indicated a trend reversal and has signaled a buy. "With good volume participation, we recommend a buy in this stock for an upside target of Rs 735. One may keep a stop loss at Rs 650," said Parekh.
Havells India | Buy | Target price: Rs 810 | Stop loss: Rs 710
The stock has formed a double bottom pattern on the daily chart at around Rs 710. It formed a positive candle, signaling positive bias. The scrip looks attractive. "The stock has been in a trending mode from a long- term perspective and we anticipate a decent rise from here on with good volumes," Parekh said.
Rajesh Bhosale, Technical Analyst, Angel Broking
Kansai Nerolac Paints | Buy | Target price: Rs 504 | Stop loss: Rs 438
The recent sharp fall in crude oil prices has been a boon for paint stocks. The scrip too has been buzzing for some time now. Technically, the scrip looks poised for a further leg of strong up move. The stock has broken above its supply zone of long-term trend line, which acted as resistance for more than five times during the last one year. A breakout has been witnessed along with a rise in volumes and positive placement of oscillators. "We recommend buying this stock at the prevailing levels for a target of Rs 504 over the next 14 sessions. The stop loss should be fixed at Rs 438," said Bhosale.
Godrej Consumer Products | Buy | Target price: Rs 760 | Stop loss: Rs 648
After undergoing a difficult time of nearly 6-8 months, the stock reflected the first sign of revival on Friday. On the daily chart, the stock has broken above last one month’s higher range which was acting as a stiff resistance and now indicates a change in polarity. The said breakout is supported with a good increase in volume and strong bullish candle. In addition, prices have closed above 50 and 89 EMA (moving averages) which indicate that the short to the medium-term trend has turned positive.

Market euphoria made indices reach new all-time highs in yet another eventful week. The Indian equity market keenly watched the general elections outcome and portfolio allocation of Modi's new team in the second innings. As the market looks bullish, Milan Vaishnav picked the following stocks based on their technical charts which can potentially help investors make the most of the market rally.
Nagaraj Shetti, Senior Technical Research Analyst, HDFC securities
Lupin | Buy | Target price: Rs 810 | Stop loss: Rs 715
The stock was in a downtrend over the last few weeks. Currently, the stock price is placed near the important lower support of Rs 720 and is making an attempt to show a bottom reversal. The lower area of Rs 720 is also indicating a possibility of the double bottom and acted as an upside reversal point in the past. Volume started to pick up and the RSI shows positive indication.
Manappuram Finance | Buy | Target price: Rs 148 | Stop loss: 128
The stock has been in a fine intermediate uptrend over the last many months and a positive sequential movement like higher tops and bottoms during the uptrend is observed. After a recent sharp upmove, the stock currently shows a consolidation pattern, without showing any sharp profit booking. The daily RSI, placed above 60, signals a possibility of further extension of the upside momentum.
Aditya Agarwala, Senior Manager- Technical Analysis, YES Securities
Cummins India | Buy | Target price: Rs 840-860 | Stop loss: Rs 760
On the daily chart, Cummins India has turned upwards after testing the neckline of an ascending triangle pattern, placed at Rs 760, backed by healthy volumes. Sustaining above Rs 800 will take the stock higher to the levels of Rs 840-860. On the weekly chart, the stock has broken out from a consolidation pattern, indicating a resumption of the bull trend. RSI has also turned upwards after taking support at the 40-level on the daily chart, suggesting bullishness in the stock.
Ujjivan Financial Services | Buy | Target price: Rs 390-405 | Stop loss: Rs 340
On the daily chart, Ujjivan Financial Services has turned upwards after breaking out from an ascending triangle pattern, indicating bullishness. On the weekly chart, it has turned higher after taking support at the lower end of the rising channel, affirming bullishness. Moreover, RSI has formed a positive reversal at the 40-level and turned north, indicating bullishness in the stock.
Jay Thakkar, CMT, AVP Equity Research, Anand Rathi Shares and Stock Brokers
V-Guard Industries | Buy | Target price: Rs 265 | Stop loss: Rs 230
The stock has seen a breakout from the symmetrical triangular pattern. The momentum indicators have also shown a buy crossover. "We recommend the stock for the target of Rs 265, with a stop loss placed at Rs 230," said Thakkar.
GAIL (India) | Buy | Target price: Rs 380 | Stop loss: RS 345
The stock has seen a breakout from the broadening pattern and the momentum indicators have seen a clear bullish crossover. "We recommend buying into this counter for the target of Rs 380 and a stop loss of Rs 345," Thakkar said.
(Views and recommendations given in this section are the analysts’ own and do not represent those of ETMarkets.com. Please consult your financial adviser before taking any position in the stock/s mentioned.)
The upside in the market though remained capped as macro data including a 5-year low GDP and weak auto sales numbers suggested that the domestic economy might not be immune to the global slowdown.
Analysts said one must execute trades with caution. Based on their recommendations, below are 11 stocks that look poised to give solid returns in 2-3 weeks:
Mazhar Mohammad, Chief Strategist – Technical Research & Trading Advisory, Chartviewindia.in
Bata India | Buy | Target price: Rs 1,397 | Stop loss: Rs 1,306
The stock appears to be stabilising after the recent correction. It has closed in the black for three consecutive sessions now. The price action has been flat around Rs 1,320, hinting at accumulation around the level. If the scrip sustains above the recent low of Rs 1,307, the counter may ideally head towards its interim top placed around Rs 1,400.
HCL Technologies | Buy | Target price: 1,150 | Stop loss: Rs 1,049
ADVERTISEMENT
After the recent correction from the highs of Rs 1,187, this counter appears to be positioning itself for a resumption. The scrip has made a Rounding Bottom-like formation on the lower time-frame charts, with a stable move around Rs 1,050. "Positional traders are advised to adopt a two-pronged strategy of buying now and adding further at lower levels around Rs 1,060 on dips. The can look for an initial target of Rs 1,150 with stop loss placed below Rs 1,049," said Mohammad.Vaishali Parekh, senior technical analyst at Prabhudas Lilladher
Godrej Consumer Products | Buy | Target price: Rs 735 | Stop loss: Rs 650
The stock formed a bullish candle pattern on the daily. It breached its 50-day moving average to give a breakout above Rs 680. It was proving as a key resistance level during the consolidation phase. The scrip has potential to rise further in the coming days. The RSI also has indicated a trend reversal and has signaled a buy. "With good volume participation, we recommend a buy in this stock for an upside target of Rs 735. One may keep a stop loss at Rs 650," said Parekh.
Havells India | Buy | Target price: Rs 810 | Stop loss: Rs 710
The stock has formed a double bottom pattern on the daily chart at around Rs 710. It formed a positive candle, signaling positive bias. The scrip looks attractive. "The stock has been in a trending mode from a long- term perspective and we anticipate a decent rise from here on with good volumes," Parekh said.
ADVERTISEMENT
Rajesh Bhosale, Technical Analyst, Angel Broking
Kansai Nerolac Paints | Buy | Target price: Rs 504 | Stop loss: Rs 438
The recent sharp fall in crude oil prices has been a boon for paint stocks. The scrip too has been buzzing for some time now. Technically, the scrip looks poised for a further leg of strong up move. The stock has broken above its supply zone of long-term trend line, which acted as resistance for more than five times during the last one year. A breakout has been witnessed along with a rise in volumes and positive placement of oscillators. "We recommend buying this stock at the prevailing levels for a target of Rs 504 over the next 14 sessions. The stop loss should be fixed at Rs 438," said Bhosale.
ADVERTISEMENT
Godrej Consumer Products | Buy | Target price: Rs 760 | Stop loss: Rs 648
After undergoing a difficult time of nearly 6-8 months, the stock reflected the first sign of revival on Friday. On the daily chart, the stock has broken above last one month’s higher range which was acting as a stiff resistance and now indicates a change in polarity. The said breakout is supported with a good increase in volume and strong bullish candle. In addition, prices have closed above 50 and 89 EMA (moving averages) which indicate that the short to the medium-term trend has turned positive.

Nagaraj Shetti, Senior Technical Research Analyst, HDFC securities
Lupin | Buy | Target price: Rs 810 | Stop loss: Rs 715
The stock was in a downtrend over the last few weeks. Currently, the stock price is placed near the important lower support of Rs 720 and is making an attempt to show a bottom reversal. The lower area of Rs 720 is also indicating a possibility of the double bottom and acted as an upside reversal point in the past. Volume started to pick up and the RSI shows positive indication.
Manappuram Finance | Buy | Target price: Rs 148 | Stop loss: 128
The stock has been in a fine intermediate uptrend over the last many months and a positive sequential movement like higher tops and bottoms during the uptrend is observed. After a recent sharp upmove, the stock currently shows a consolidation pattern, without showing any sharp profit booking. The daily RSI, placed above 60, signals a possibility of further extension of the upside momentum.
Aditya Agarwala, Senior Manager- Technical Analysis, YES Securities
Cummins India | Buy | Target price: Rs 840-860 | Stop loss: Rs 760
On the daily chart, Cummins India has turned upwards after testing the neckline of an ascending triangle pattern, placed at Rs 760, backed by healthy volumes. Sustaining above Rs 800 will take the stock higher to the levels of Rs 840-860. On the weekly chart, the stock has broken out from a consolidation pattern, indicating a resumption of the bull trend. RSI has also turned upwards after taking support at the 40-level on the daily chart, suggesting bullishness in the stock.
Ujjivan Financial Services | Buy | Target price: Rs 390-405 | Stop loss: Rs 340
On the daily chart, Ujjivan Financial Services has turned upwards after breaking out from an ascending triangle pattern, indicating bullishness. On the weekly chart, it has turned higher after taking support at the lower end of the rising channel, affirming bullishness. Moreover, RSI has formed a positive reversal at the 40-level and turned north, indicating bullishness in the stock.
Jay Thakkar, CMT, AVP Equity Research, Anand Rathi Shares and Stock Brokers
V-Guard Industries | Buy | Target price: Rs 265 | Stop loss: Rs 230
The stock has seen a breakout from the symmetrical triangular pattern. The momentum indicators have also shown a buy crossover. "We recommend the stock for the target of Rs 265, with a stop loss placed at Rs 230," said Thakkar.
GAIL (India) | Buy | Target price: Rs 380 | Stop loss: RS 345
The stock has seen a breakout from the broadening pattern and the momentum indicators have seen a clear bullish crossover. "We recommend buying into this counter for the target of Rs 380 and a stop loss of Rs 345," Thakkar said.
(Views and recommendations given in this section are the analysts’ own and do not represent those of ETMarkets.com. Please consult your financial adviser before taking any position in the stock/s mentioned.)
Too busy to trade in stocks? Invest in Mutual Funds with ET Money!
Bookmark or read stories offline -
Download ET Markets APP
Download ET Markets APP
ADVERTISEMENT

