
Sensex stuck for 2 years: What a ‘time correction’ means for your SIP and investments

1/9
Sensex hasn’t hit a new high in 2 years: What is a time correction?
The Sensex has spent nearly two years below its previous record high of September 26, 2024. Unlike a sharp market crash, this period has been marked by largely sideways movement. This is known as a time correction, a time when markets spend months or years struggling to make meaningful gains rather than falling sharply in a short period.

2/9
Market correction vs time correction: Why are they different?
A price correction can be painful because your portfolio value falls quickly. A time correction works differently. Your investments may remain around the same value for months while inflation reduces their purchasing power. Goals can appear farther away, and investors may become frustrated when fixed deposits seem to be doing better than their equity portfolios.
3/9
Sensex history: Previous corrections lasted 3–5 years
History shows that market recoveries do not always happen quickly. The 2008 crash took more than a year to complete, followed by around 20 months of recovery. The 1994 correction lasted 27 months, with another 31 months needed to recover. The 2000 technology bubble correction took nearly four years through its fall and recovery.
Amazon Top Deals
POWERED BY


4/9
Why today’s market correction looks different
The current phase differs from earlier crises in several ways. India has stronger domestic financial participation, continued SIP flows, lower apparent leverage and a broader investor base. Experts cited in the source describe the current phase more as a prolonged valuation-and-time correction rather than a banking or balance-sheet crisis.
5/9
SIP investors are still investing despite the flat market
SIP contributions have remained resilient even as the market has moved sideways. Monthly SIP inflows recently crossed ₹32,000 crore. However, 53.82 lakh SIP closures, maturities and discontinuations were recorded against 66.39 lakh new registrations. The stoppage ratio improved to 81% in August 2026 but remained elevated, pointing to some investor fatigue.
6/9
SIP returns can look disappointing before recovering
A difficult phase does not necessarily mean a long-term SIP has failed. DSP Asset Managers analysed every 10-year, Sensex Total Return index (TRI) SIP over the past 30 years. The SIP delivered returns above debt in 99% of cases, with a median return of 14.2%. Yet 81% of these SIPs experienced negative returns at some point during their journey.

7/9
Should you stop your SIP during a flat market?
Stopping an SIP during a prolonged correction can mean missing the benefit of buying more units when prices are subdued. The source highlights rupee-cost averaging as one reason SIPs can work through time corrections. Two weak years on an index do not automatically invalidate a 7–10-year investment plan, provided the investor’s goals and risk capacity remain unchanged.
8/9
Is the stock market cheap after 2 years of sideways returns?
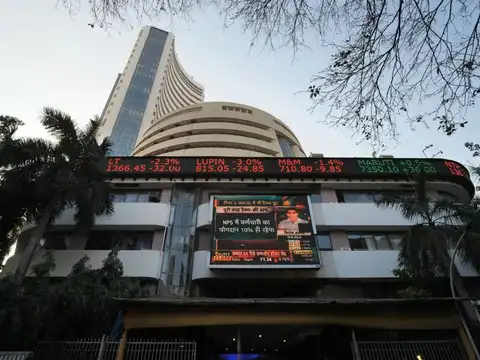
A flat market does not automatically mean that stocks are cheap. While corporate revenues and profits have continued to grow and valuations have moderated in parts of the market, experts caution against increasing equity allocation simply because the index has remained range-bound. Valuations, earnings growth and the investor’s long-term allocation remain important.

9/9
What should investors do during a time correction?
Experts suggest staying disciplined rather than reacting to short-term market movements. SIPs can help average purchase costs, while STPs can spread a large lump sum over time and reduce the risk of investing everything at an unfavourable point. Additional equity exposure should depend on a genuinely long-term horizon, ability to tolerate further declines, valuations and earnings—not simply on how much the market has already fallen.