What lifetime high? Facebook alone bigger than all Indian stocks in m-cap
India has a free-float m-cap of $392 billion, which was lower than that of Facebook.
By Amit Mudgill, ETMarkets.com | Updated:

NEW DELHI: The domestic stock market has just entered the elite $2 trillion club and is only the second emerging market after China to boast of a market-cap of this size.
A $2 trillion market with very low retail penetration in itself is a feat. But it seems US multinationals are too big for India, or for that matter, its peer BRICS in value terms.
US stocks have climbed nearly 14 per cent since US President Donald Trump won the presidential elections in November 2016. Domestic stocks have gained around 12 per cent during this period. With both Indian and US stock indices hitting record highs for some time now, the free-float m-cap of individual US multinationals have risen in absolute terms, so much that they have topped total m-caps of many stock exchanges globally.
For example, Mark Zuckerberg’s Facebook alone is bigger than all listed companies in India, when you compare the free-float market capitalisation (m-cap).
India, where promoters traditionally prefer to hold majority stake in their companies, has a free-float market capitalisation of $392 billion, which was lower than Facebook’s free-float market capitalisation of $403 billion, BofA-ML noted in a report.
According to a recent study, Indian promoters (excluding government) owned 27.54 per cent of the BSE200 stocks, while foreign promoters accounted for 8.96 per cent. Government holds about 12 per cent in the BSE200 index companies.
US tech giants Apple and Amazon together hold a free-float m-cap of $1.72 trillion, which equals to whole of China’s $1.19 trillion m-cap (free-float).
Visa and MasterCard together ($326 billion) have free-float m-cap, which equals the aggregate free-float m-cap of all the stocks listed on the Brazilian bourses.
IBM’s free-float market-cap of $161 billion alone is higher than the Russian stock exchange’s free-float m-cap of $160 billion. Similarly, WalMart and Costco at $297 billion m-cap are equal to South Africa’s total free-float market-cap of $296 billion. The comparison of market-cap was drawn in April, the BofA-ML report said.
A $2 trillion market with very low retail penetration in itself is a feat. But it seems US multinationals are too big for India, or for that matter, its peer BRICS in value terms.
US stocks have climbed nearly 14 per cent since US President Donald Trump won the presidential elections in November 2016. Domestic stocks have gained around 12 per cent during this period. With both Indian and US stock indices hitting record highs for some time now, the free-float m-cap of individual US multinationals have risen in absolute terms, so much that they have topped total m-caps of many stock exchanges globally.
For example, Mark Zuckerberg’s Facebook alone is bigger than all listed companies in India, when you compare the free-float market capitalisation (m-cap).
India, where promoters traditionally prefer to hold majority stake in their companies, has a free-float market capitalisation of $392 billion, which was lower than Facebook’s free-float market capitalisation of $403 billion, BofA-ML noted in a report.
According to a recent study, Indian promoters (excluding government) owned 27.54 per cent of the BSE200 stocks, while foreign promoters accounted for 8.96 per cent. Government holds about 12 per cent in the BSE200 index companies.
ADVERTISEMENT
US tech giants Apple and Amazon together hold a free-float m-cap of $1.72 trillion, which equals to whole of China’s $1.19 trillion m-cap (free-float).
Visa and MasterCard together ($326 billion) have free-float m-cap, which equals the aggregate free-float m-cap of all the stocks listed on the Brazilian bourses.
IBM’s free-float market-cap of $161 billion alone is higher than the Russian stock exchange’s free-float m-cap of $160 billion. Similarly, WalMart and Costco at $297 billion m-cap are equal to South Africa’s total free-float market-cap of $296 billion. The comparison of market-cap was drawn in April, the BofA-ML report said.
Too busy to trade in stocks? Invest in Mutual Funds with ET Money!
Bookmark or read stories offline -
Download ET Markets APP
Download ET Markets APP
Related Articles
 Aamir Khan's co-actress rejected marriage for 60 years until a Facebook message changed her life forever. Why did she finally marry a famous scientist?2026-06-19T01:31:22Z
- Meta Platforms hit by outage as Instagram, Facebook see surge in user complaints2026-06-12T14:53:37Z
- Facebook Instagram messenger Down? Why users faced Facebook query error and Instagram outage during Meta disruption2026-06-12T14:32:47Z

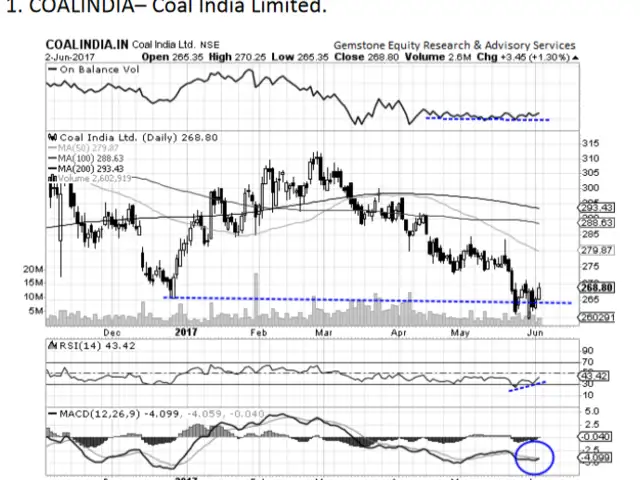
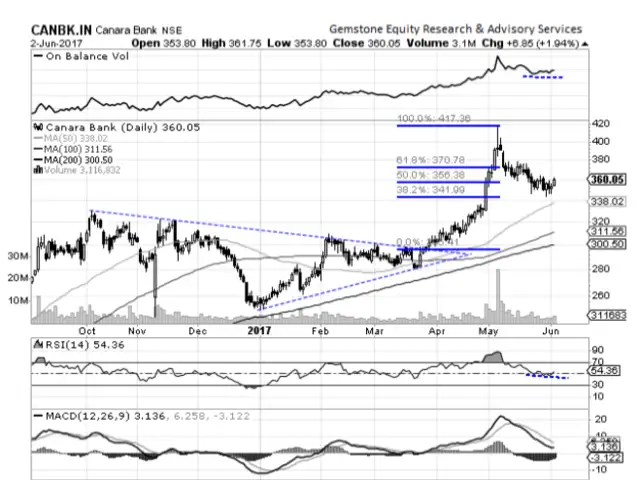
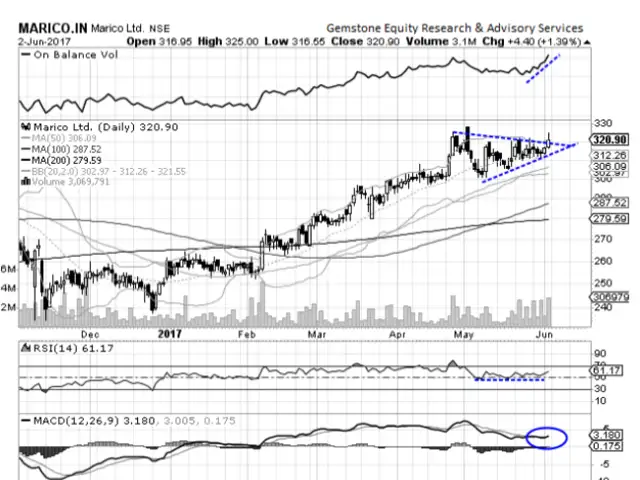
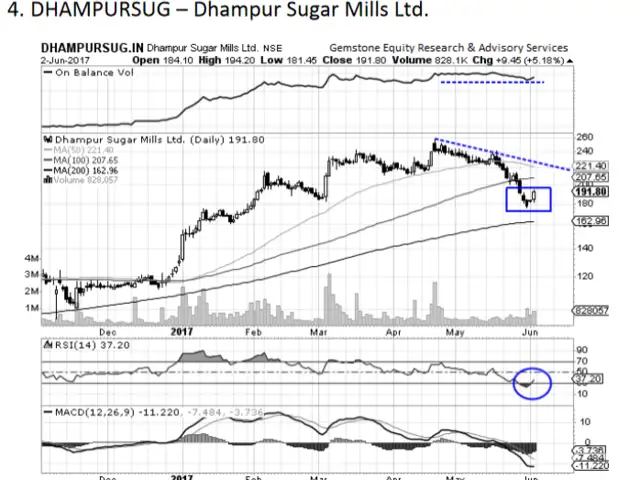
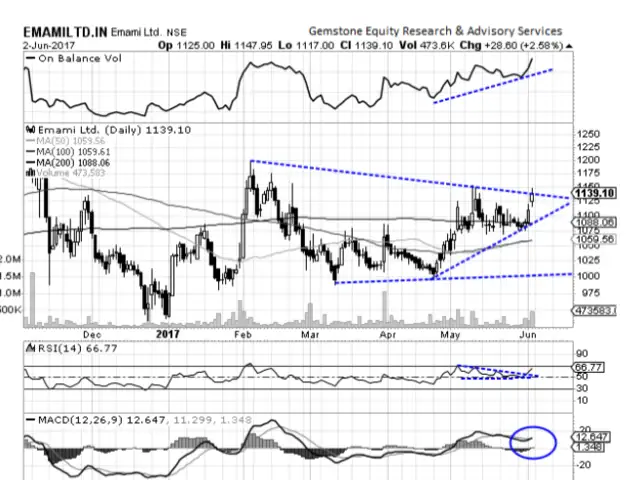
Reading chart patterns, in-house technical analyst Milan Vaishnav listed out the following five stocks as potential buy calls.


ADVERTISEMENT

