On Monday, Nifty is likely to see the 11,560 and 11,610 levels act as stiff resistance, while supports are expected to come in at 11,465 and 11,410.
While trading on anticipated lines, the domestic equity market consolidated in a defined range on Friday, before ending with a modest loss. The trading range remained narrow, and market participants exhibited an exhausted and lacklustre behaviour, and this was evident from the formation of a lower tops and higher bottoms on the charts.
After oscillating in a 60-point range, Nifty ended the day with a loss of 58.80 points, or 0.51 per cent. The market is likely to see a lukewarm start to the week on Monday. Nifty is expected to kick off the week on a defensive note, and we expect the market to continue exhibiting a corrective bias. It may show tentative behaviour. The market continues to remain overstretched on the short-term charts, and is not likely to show any runaway rise in the immediate short term.
On any rise, Nifty will face resistance in the 11650-11700 range, and higher it goes, the more vulnerable it will be to profit taking.
On Monday, Nifty is likely to see the 11,560 and 11,610 levels act as stiff resistance, while supports are expected to come in at 11,465 and 11,410.
The RSI on the daily chart stood at 60.6359. It remained neutral and did not show any divergence against price. The MACD remained bullish and trades above its signal line.
ADVERTISEMENT
Pattern analysis on the daily charts showed Nifty made a sharp rise following the announcement of fiscal stimulus, and it created a gap between the 50- and the 100-DMAs. On its rise, Nifty faced resistance between 11,600 and 11,700 levels and then retraced from those highs. It is expected that the gap created a couple of days back will get filled going ahead.
Weekly options data showed the upward moves may remain capped below the 11,600 mark. We expect the market to find supply with every rise. The gains are likely to stay concentrated and stock-specific. Market breadth remains a concern, and for any move to sustain at higher levels, it needs to be healthy as well.
(Milan Vaishnav, CMT, MSTA is a Consultant Technical Analyst at Gemstone Equity Research & Advisory Services, Vadodara. He can be reached at milan.vaishnav@equityresearch.asia)
Top 4 stock recommendations for this week
1/6
Benchmark equity indices BSE Sensex and NSE Nifty registered their biggest weekly gains in four months for the week ended September 27. Investor sentiment remained upbeat in equity market after FM Nirmala Sitharaman last Friday said that India has become a highly competitive investment destination post corporate tax reduction as the rates are now lower than that in China and most Southeast Asian countries.
Here are four stocks that could prove good trading plays this week:
Benchmark equity indices BSE Sensex and NSE Nifty registered their biggest weekly gains in four months for the week ended September 27. Investor sentiment remained upbeat in equity market after FM Ni..
Read More
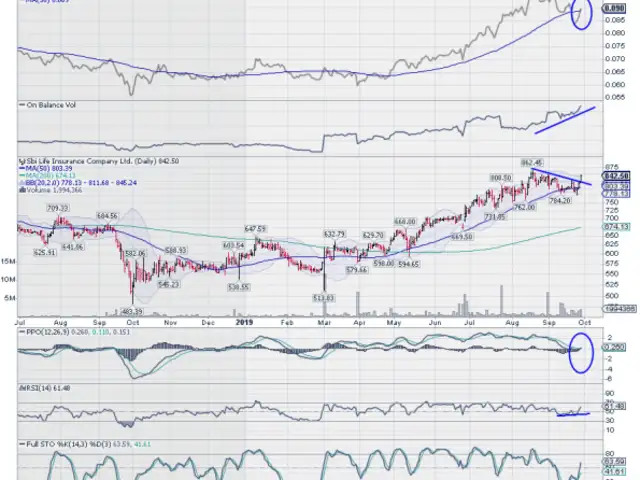
The stock suffered a mild corrective decline after it marked its high. The price took support at the 50-DMA, and a couple of signs have emerged which point towards likely resumption of an up move. The PPO has turned positive while MACD has shown a positive crossover. It is now bullish and trades above its signal line. While the stock price is yet to mark a fresh high, the OBV—On Balance Volume has already set a new high. The RS line, when compared against the broader markets appears to be moving higher, and it has also penetrated its 50-DMA. Any close below 850 should be treated as a stop-loss for this trade.
The stock suffered a mild corrective decline after it marked its high. The price took support at the 50-DMA, and a couple of signs have emerged which point towards likely resumption of an up move. Th..
Read More
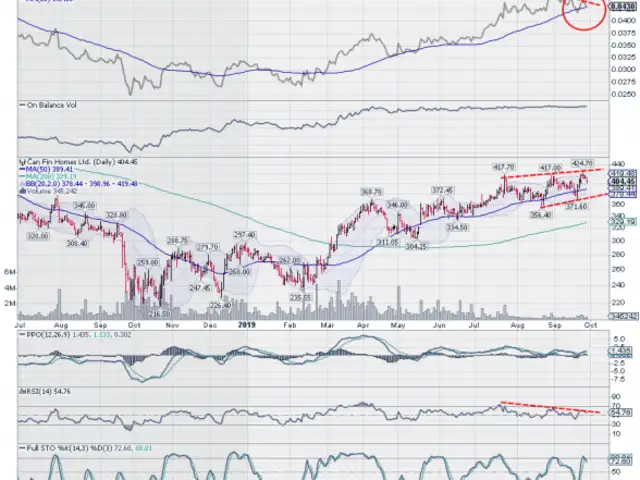
After grossly underperforming the broader markets, the stock is showing signs of some possible retracement from current levels. It failed to break above the 424-levels. A clear bearish divergence is observed on RSI; the price was marking higher tops while the RSI made lower tops during the same time-frame. The MACD is sharply moving towards creating a negative crossover. The RS Line appears to be reversing its trend, and it is above to breach its 50-DMA on the downside. Any Close above the 420 levels should be treated as a stop-loss for this trade.
After grossly underperforming the broader markets, the stock is showing signs of some possible retracement from current levels. It failed to break above the 424-levels. A clear bearish divergence is ..
Read More
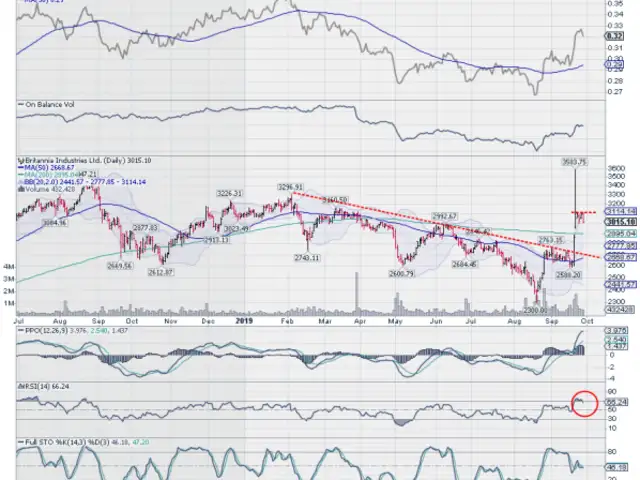
The stock is showing few signs of exhaustion and may show some corrective moves. The level of 3115 is an crucial resistance going ahead. After a steep up-move over the past couple of days, the stock has pulled itself inside the Bollinger band. The RSI has just crossed under 70 from the overbought zone, and this is a bearish sign. The price action has created a gap near the 200-DMA area, and this gap is expected to get filled. Any close above the 3115 levels should be treated as a stop-loss of this trade.
The stock is showing few signs of exhaustion and may show some corrective moves. The level of 3115 is an crucial resistance going ahead. After a steep up-move over the past couple of days, the stock ..
Read More
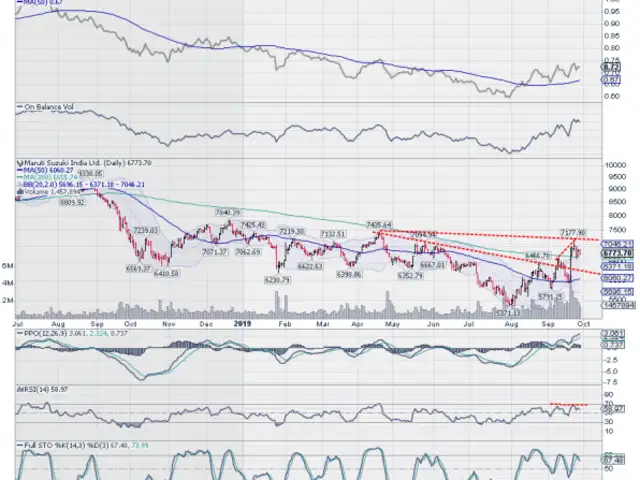
The stock participated in the general up move that was seen last week, but the price halted its upside just below the 7200
levels. The stock has presently pulled itself inside the upper Bollinger band. The price action has also resulted in a sharp bearish divergence with the RSI. While the price marked higher top, the RSI did not mark any higher top and stayed below its pattern resistance levels. This shows lack of strength in the up move. The current technical setup shows that the retracement may continue over the coming days. Any close above the 7000 levels should be treated as a stop-loss for this trade.
The stock participated in the general up move that was seen last week, but the price halted its upside just below the 7200
levels. The stock has presently pulled itself inside the upper Bollinger ban..
Read More
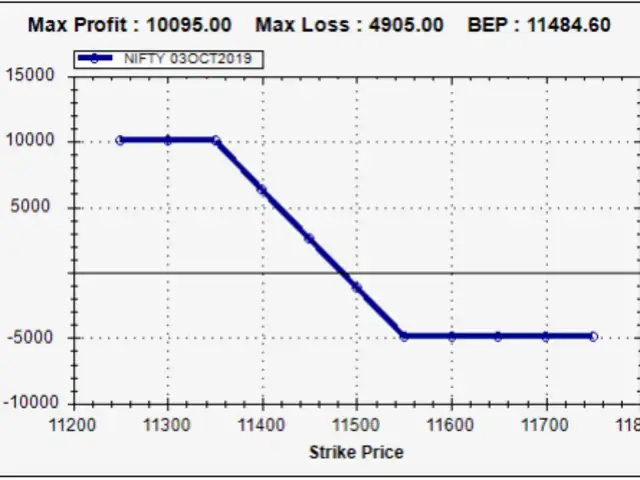
The options data as of Friday Close for the October 03, 2019 expiry shows that the Call OI is seen built at 11600 strikes; this level may pose resistance at higher level while the markets consolidate.
Buy NIFTY 03OCT 11550 CALL at 82 and Sell NIFTY 03OCT 11350 CALL at 216.60. Receive Net Premium of Rs 10095. Maximum Potential Profit of Rs 10095. Maximum Possible Loss Rs 4905.
(IMPORTANT: The Option Prices shown are as of Friday’s Close. The Pay-off Chart, Maximum Loss and Maximum Profit Potential can vary as per the actual execution price)
The options data as of Friday Close for the October 03, 2019 expiry shows that the Call OI is seen built at 11600 strikes; this level may pose resistance at higher level while the markets consolidate..
(Disclaimer: The opinions expressed in this column are that of the writer. The facts and opinions expressed here do not reflect the views of www.economictimes.com.)