Tata Elxsi, Nestle, VIP Industries among stocks that analysts say can deliver gains in near term
Here are the top stocks that analysts say can offer solid gains over the next 2-3 weeks.
By ETMarkets.com | Updated:

NEW DELHI: The tide seems to have turned in favour of the bulls on Dalal Street after Finance Minister Nirmala Sitharaman cut for Indian companies, sending the fireworks on Dalal Street.
The tax bonanza dispelled earnings worries that led to massive euphoria on Friday with a spillover effect seen in Monday's session.
BSE benchmark Sensex zoomed some 1,300 points in and topped the 39,000 mark while NSE Nifty jumped past 11,600.
With the possibility of some positive developments on the Sino-US trade war front the rally might just prove to be sustainable.
"Indications are in favour of further surge in the index but the move could be gradual from hereon. We feel sustainability above 11,250 in Nifty would be critical to carry this momentum. On higher side, 11,450-11,600 zone would act as hurdle while 11,000-11,100 zone will be crucial in case of profit taking. We advise focusing on stock selection and trade management however it’s easier said than done after this vertical rise," Ajit Mishra Vice President, Research, Religare Broking.
Here are the top stocks that analysts say can offer solid gains over the next 2-3 weeks.
Mazhar Mohammad, Chief Strategist – Technical Research & Trading Advisory, Chartviewindia.in
Tata Elxsi | Buy | Target Price: Rs 747 | Stop Loss: Rs 604
IT sector didn’t participate in Friday’s gigantic rally. From this space, this counter appears to have chalked a decent basing formation around Rs 600 level for the last couple of weeks. Hence, positional traders are advised to adopt a two-pronged strategy of buying now and on declines at Rs 620–610 and look for an initial target of Rs 670. However, once it manages a sustainable breakout above 670 levels then a bigger target of Rs 747 can’t be ruled out. Stop suggested for the trade is a close below Rs 604 levels.
Nestle | Buy | Target Price: Rs 15,547 | Stop Loss: Rs 12,490
In the last 11 months, this counter has carved out a well defined ascending channel and appears to have registered a breakout above the same which is projecting a target of Rs 15,550 levels. However, as price behaviour of last session in the entire market is looking quite abnormal positional traders will be better off by adopting a two-pronged strategy of buying now and adding further in the zone of Rs 13,000–12,700 and eventually look for a target of Rs 15,547. Stop suggested for the trade is a close below Rs 12,490.
Rajesh Bhosale, Technical Analyst Angel Broking
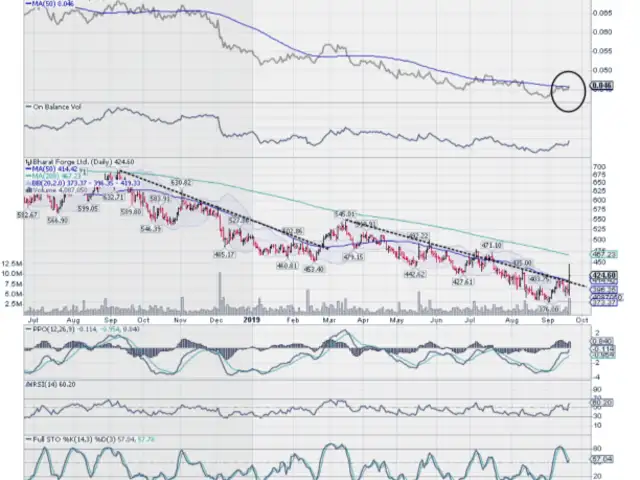
Bharat Forge | Buy | Target Price: Rs 465 | Stop Loss: Rs 401
The stock price of Bharat Forge has given a multiple pattern bullish breakout. On the daily chart, stock price has given a bullish reversal pattern breakout known as ‘Inverse Head and Shoulder’ whereas on the weekly chart stock price has given a trend line breakout joining lower tops from all time high levels.
The above said breakouts are supported with a good increase in volume. In addition, momentum oscillator i.e. RSI on the weekly time frame has given a fresh bullish crossover with its smoothened average in the oversold zone supporting the buy call. Looking at all the above evidence, the analyst recommends buying this stock at current levels for a target of Rs 465 over the next 14 sessions. The stop loss should be fixed at Rs 401.
VIP Industries | Buy | Target Price: Rs 510 | Stop Loss: Rs 429
On the daily chart, the stock started moving in a ‘Higher Top Higher Bottom’ formation a bullish price cycle. In addition, we are witnessing a bullish reversal pattern breakout known as ‘Cup N Handle’.
Moreover, stock has closed above 200-DMA, which was previously acting as stiff resistance and now indicates a change in polarity. Momentum oscillator i.e. RSI has just crossed in the overbought territory but going with the strong positive momentum and the analyst senses a further strong leg of up move in the near term. "Looking at all the above scenario we recommend buying this stock at current levels for a target of Rs 510 over the next 14 sessions. The stop loss should be fixed at Rs 429.4," Bhosale said.
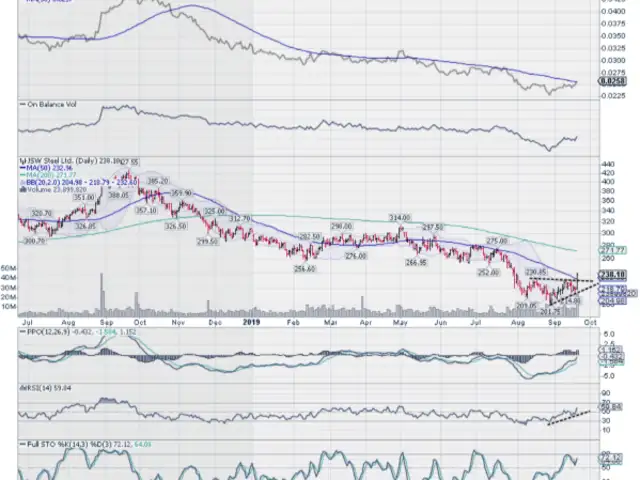
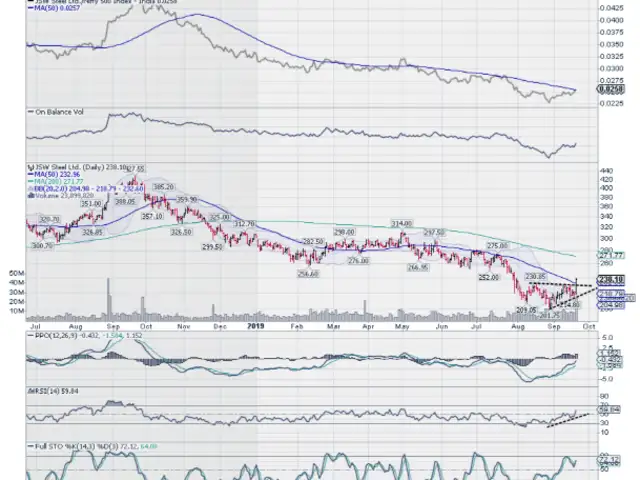
Deepak Nitrate | Buy | Target Price: Rs 325 | Stop Loss: Rs 267
After trading in a narrow range for the last few weeks, stock formed ‘Descending Triangle’ bullish breakout on the daily chart. The said breakout is supported with a bullish candle and increasing volume. Momentum oscillator i.e. RSI as well gave a fresh buy crossover with its smoothened moving average and has entered the positive zone. In addition, prices have closed above 50DEMA and 100-DMA, which indicates a short to medium term bullishness. Going with all the above setup, the analyst recommends buying this stock at current levels for a target of Rs 325 over the next 14 sessions. The stop loss should be fixed at Rs 267.
Jay Thakkar, CMT – Head Technical & Derivatives Research, Anand Rathi
JK Paper | Buy | Target Price: Rs 152 | Stop Loss: Rs 128
The stock has good support at its uptrend line and it has been forming higher tops and bottoms. The stock seems to have completed wave 4 and wave 5 up seems to have started. The stock is a buy for a target price of Rs 152 and a stop loss of Rs 128, the expert said.
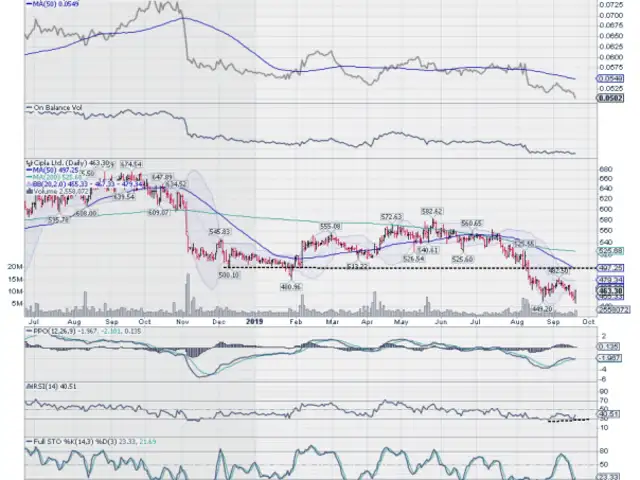
Finolex Industries | Buy | Target Price: Rs 630 | Stop Loss: Rs 550
The stock has provided a breakout from the falling channel with a clear buy crossover in its momentum indicator MACD. The stock has also provided a breakout from the symmetrical triangular pattern. The expert recommends buying this stock for the target of Rs 630 with a stop loss of Rs 550.
Timken India | Buy | Target Price: Rs 840 | Stop Loss: Rs 715
The stock has provided a breakout from the falling channel and the momentum indicator MACD has provided a buy crossover. The stock has also provided a breakout from the inverse head and shoulders pattern and thus the analyst recommends buying the stock for a target price of Rs 840 and a stop loss of Rs 715.
Mustafa Nadeem, CEO, Epic Research
NIIT Tech |Buy | Target Price: Rs 1,430 | Stop Loss: Rs 1,400
The stock took the support of the trendline and gave a breakout of the falling price channel on a closing basis on the daily chart. We recommend buying above Rs 1,415 for the target price of Rs 1,430 with the stop loss of Rs 1,400.

(Views and recommendations given in this section are the analyst's own and do not represent those of ETMarkets.com. Please consult your financial adviser before taking any position in the stock/s mentioned)
The tax bonanza dispelled earnings worries that led to massive euphoria on Friday with a spillover effect seen in Monday's session.
BSE benchmark Sensex zoomed some 1,300 points in and topped the 39,000 mark while NSE Nifty jumped past 11,600.
With the possibility of some positive developments on the Sino-US trade war front the rally might just prove to be sustainable.
"Indications are in favour of further surge in the index but the move could be gradual from hereon. We feel sustainability above 11,250 in Nifty would be critical to carry this momentum. On higher side, 11,450-11,600 zone would act as hurdle while 11,000-11,100 zone will be crucial in case of profit taking. We advise focusing on stock selection and trade management however it’s easier said than done after this vertical rise," Ajit Mishra Vice President, Research, Religare Broking.
Here are the top stocks that analysts say can offer solid gains over the next 2-3 weeks.
ADVERTISEMENT
Mazhar Mohammad, Chief Strategist – Technical Research & Trading Advisory, Chartviewindia.in
Tata Elxsi | Buy | Target Price: Rs 747 | Stop Loss: Rs 604
IT sector didn’t participate in Friday’s gigantic rally. From this space, this counter appears to have chalked a decent basing formation around Rs 600 level for the last couple of weeks. Hence, positional traders are advised to adopt a two-pronged strategy of buying now and on declines at Rs 620–610 and look for an initial target of Rs 670. However, once it manages a sustainable breakout above 670 levels then a bigger target of Rs 747 can’t be ruled out. Stop suggested for the trade is a close below Rs 604 levels.
Nestle | Buy | Target Price: Rs 15,547 | Stop Loss: Rs 12,490
ADVERTISEMENT
In the last 11 months, this counter has carved out a well defined ascending channel and appears to have registered a breakout above the same which is projecting a target of Rs 15,550 levels. However, as price behaviour of last session in the entire market is looking quite abnormal positional traders will be better off by adopting a two-pronged strategy of buying now and adding further in the zone of Rs 13,000–12,700 and eventually look for a target of Rs 15,547. Stop suggested for the trade is a close below Rs 12,490.
Rajesh Bhosale, Technical Analyst Angel Broking
ADVERTISEMENT
Bharat Forge | Buy | Target Price: Rs 465 | Stop Loss: Rs 401
The stock price of Bharat Forge has given a multiple pattern bullish breakout. On the daily chart, stock price has given a bullish reversal pattern breakout known as ‘Inverse Head and Shoulder’ whereas on the weekly chart stock price has given a trend line breakout joining lower tops from all time high levels.
The above said breakouts are supported with a good increase in volume. In addition, momentum oscillator i.e. RSI on the weekly time frame has given a fresh bullish crossover with its smoothened average in the oversold zone supporting the buy call. Looking at all the above evidence, the analyst recommends buying this stock at current levels for a target of Rs 465 over the next 14 sessions. The stop loss should be fixed at Rs 401.
VIP Industries | Buy | Target Price: Rs 510 | Stop Loss: Rs 429
On the daily chart, the stock started moving in a ‘Higher Top Higher Bottom’ formation a bullish price cycle. In addition, we are witnessing a bullish reversal pattern breakout known as ‘Cup N Handle’.
Moreover, stock has closed above 200-DMA, which was previously acting as stiff resistance and now indicates a change in polarity. Momentum oscillator i.e. RSI has just crossed in the overbought territory but going with the strong positive momentum and the analyst senses a further strong leg of up move in the near term. "Looking at all the above scenario we recommend buying this stock at current levels for a target of Rs 510 over the next 14 sessions. The stop loss should be fixed at Rs 429.4," Bhosale said.
Deepak Nitrate | Buy | Target Price: Rs 325 | Stop Loss: Rs 267
After trading in a narrow range for the last few weeks, stock formed ‘Descending Triangle’ bullish breakout on the daily chart. The said breakout is supported with a bullish candle and increasing volume. Momentum oscillator i.e. RSI as well gave a fresh buy crossover with its smoothened moving average and has entered the positive zone. In addition, prices have closed above 50DEMA and 100-DMA, which indicates a short to medium term bullishness. Going with all the above setup, the analyst recommends buying this stock at current levels for a target of Rs 325 over the next 14 sessions. The stop loss should be fixed at Rs 267.
Jay Thakkar, CMT – Head Technical & Derivatives Research, Anand Rathi
JK Paper | Buy | Target Price: Rs 152 | Stop Loss: Rs 128
The stock has good support at its uptrend line and it has been forming higher tops and bottoms. The stock seems to have completed wave 4 and wave 5 up seems to have started. The stock is a buy for a target price of Rs 152 and a stop loss of Rs 128, the expert said.
Finolex Industries | Buy | Target Price: Rs 630 | Stop Loss: Rs 550
The stock has provided a breakout from the falling channel with a clear buy crossover in its momentum indicator MACD. The stock has also provided a breakout from the symmetrical triangular pattern. The expert recommends buying this stock for the target of Rs 630 with a stop loss of Rs 550.
Timken India | Buy | Target Price: Rs 840 | Stop Loss: Rs 715
The stock has provided a breakout from the falling channel and the momentum indicator MACD has provided a buy crossover. The stock has also provided a breakout from the inverse head and shoulders pattern and thus the analyst recommends buying the stock for a target price of Rs 840 and a stop loss of Rs 715.
Mustafa Nadeem, CEO, Epic Research
NIIT Tech |Buy | Target Price: Rs 1,430 | Stop Loss: Rs 1,400
The stock took the support of the trendline and gave a breakout of the falling price channel on a closing basis on the daily chart. We recommend buying above Rs 1,415 for the target price of Rs 1,430 with the stop loss of Rs 1,400.
The euphoria on the Dalal Street is running high and wild following Finance Minister Nirmala Sitharaman's cut in corporate tax. However, technical indicators suggest that there are chances that such a massive move can push the market into a period of consolidation. Here are four stocks that could prove good trading plays this week:

(Views and recommendations given in this section are the analyst's own and do not represent those of ETMarkets.com. Please consult your financial adviser before taking any position in the stock/s mentioned)
Too busy to trade in stocks? Invest in Mutual Funds with ET Money!
Bookmark or read stories offline -
Download ET Markets APP
Download ET Markets APP
ADVERTISEMENT

