Gautam Duggad, head of research, Motilal Oswal Financial Services, also says “such significant corrections opened up equally significant investment opportunities in the past”.
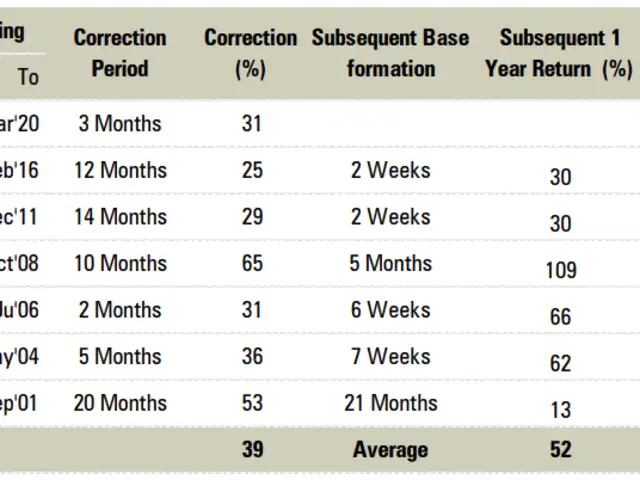
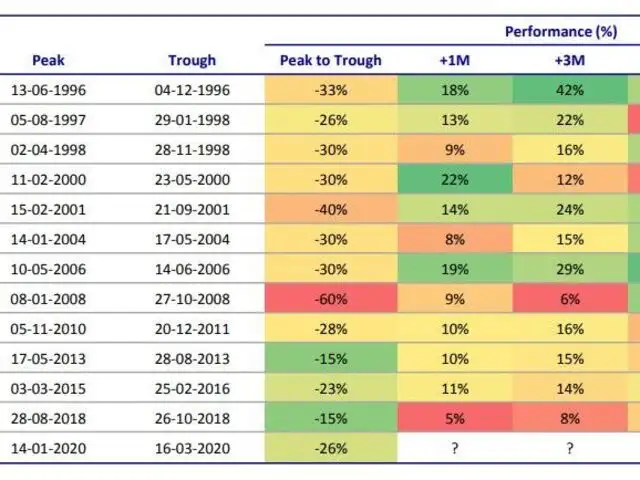
The Nifty has corrected more than 28 per cent in the last three months on concerns over the spread of Covid-19. Historically, there have been six instances, in the last two decades, of correction of more than 25 per cent. Out of these, in four instances, the correction was to the tune of over 30 per cent. In all four instances, six-month forward returns for Nifty were positive while in three instances returns have been minimum 35 per cent and maximum 46 per cent.
After the steep correction of 28 per cent, several data points indicate markets are closer to the bottom of the current correction phase. The market cap-to-GDP ratio is at its lowest since FY10. The Nifty earnings yield versus the 10-year bond yield is comfortably above its 10-year average. Nifty one-year forward PE of 15.1 — a 12 per cent discount to long-term average of 17.2 and at levels last seen in February 2014. Also, at 2 times, the Nifty one-year forward price to book is well below the historical average of 2.6.
Should you invest post 30% correction? History says yes!
1/5
Historically, investing post 30% correction has yielded handsome returns over one year period for investors, according to a report by ICICI Securities. Nifty has corrected more than 30% in the last three months and witnessed a rebound on Friday.
Historically, investing post 30% correction has yielded handsome returns over one year period for investors, according to a report by ICICI Securities. Nifty has corrected more than 30% in the last t..
Read More
Historically, there have been six instances, in the last two decades, of correction of more than 25%. Out of these in four instances the correction was to the tune of ~ 30%. In all of these 4 instances, one-year and two-year forward returns for Nifty have been positive and in three instances, returns have been 30% and 50% respectively.
Historically, there have been six instances, in the last two decades, of correction of more than 25%. Out of these in four instances the correction was to the tune of ~ 30%. In all of these 4 instanc..
Read More
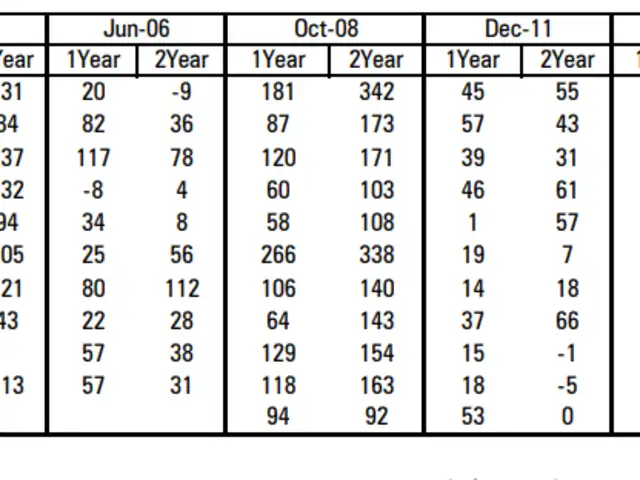
Cyclical led by banking, auto and capital goods were the major outperformers with returns more than 60% and 90% in one year and two year, respectively.
Cyclical led by banking, auto and capital goods were the major outperformers with returns more than 60% and 90% in one year and two year, respectively.
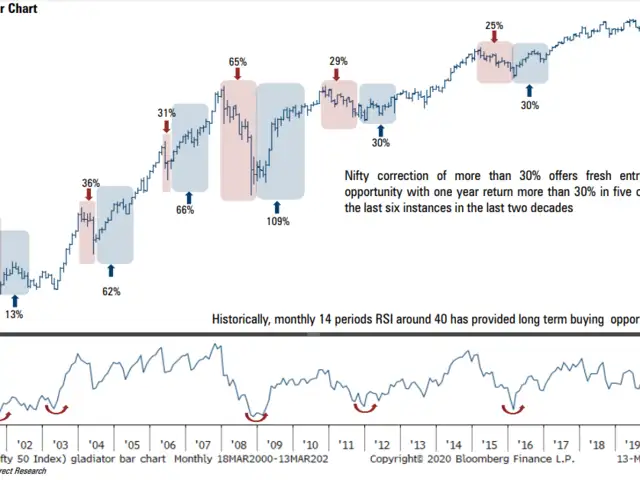
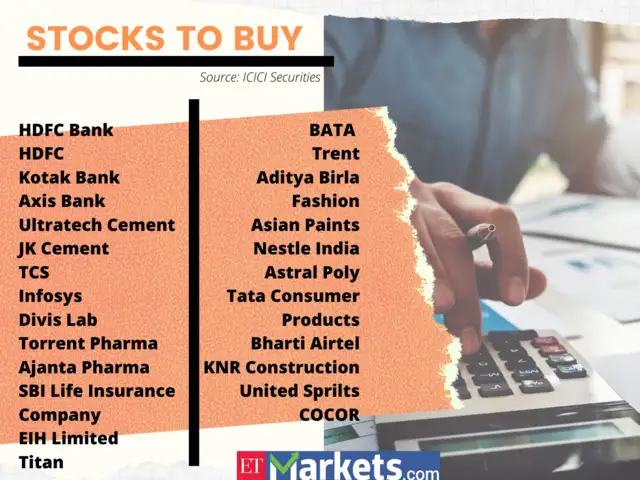
“Nifty's correction of more than 30 per cent offers fresh entry opportunity with one-year return of more than 30 per cent in five of the last six instances in the last two decades,” said Pankaj Pandey, head of research, ICICI Securities.
These charts tell you where the money is
1/10
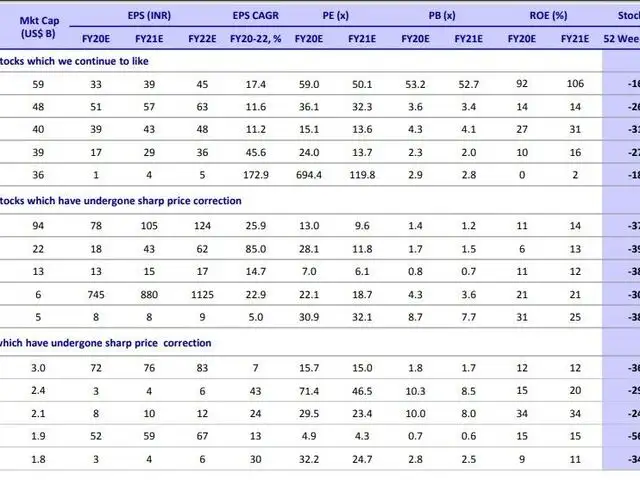
Indian equity markets have corrected significantly over the last one month (Nifty down ~26% from its 52-week high of 12,362 to the lows of 16th March 20) in tandem with global equity markets due to headwinds from the Covid-19 outbreak across multiple countries. However, such significant corrections have opened up equally significant investment opportunities in the past. Here are some important investment parameters across cycles in the last two decades and a few investment bets. (Source: MOSL)
Indian equity markets have corrected significantly over the last one month (Nifty down ~26% from its 52-week high of 12,362 to the lows of 16th March 20) in tandem with global equity markets due to h..
Read More
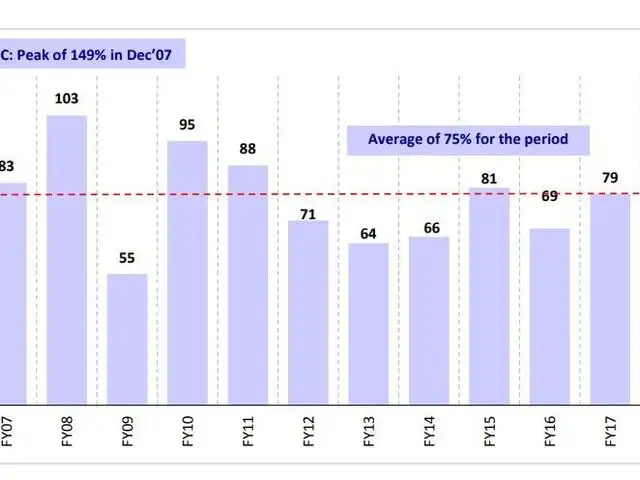
Market cap-to-GDP ratio has fallen swiftly from 79% as on FY19 to 58% (FY20E GDP) – much below long-term average of 75% and closer to levels last seen during FY09. The ratio has been quite stable over FY15-19 in the 70-80% band. The lowest in the last two decades has been 42% in FY04. However, the number of listed and traded companies then were much lower than today. The ratio hit a peak of 149% in December 2007 during the 2003-08 bull run.
Market cap-to-GDP ratio has fallen swiftly from 79% as on FY19 to 58% (FY20E GDP) – much below long-term average of 75% and closer to levels last seen during FY09. The ratio has been quite stable ove..
Read More
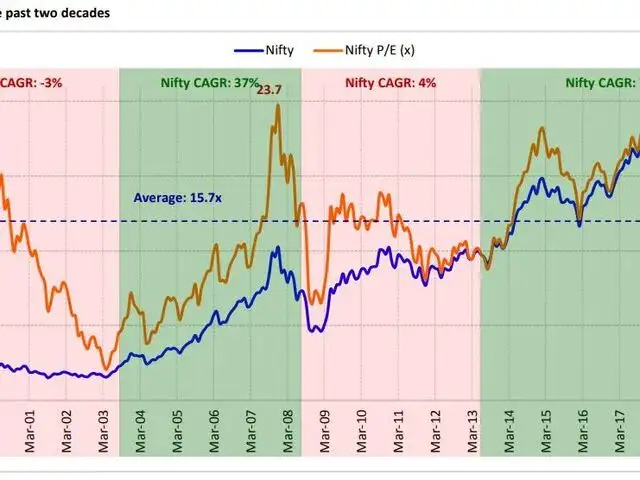
The last two decades saw several phases and cycles in the Nifty where valuations have mean-reverted even as earnings drove long-term markets returns. Post the recent fall, the Nifty returns CAGR since March 13 stands at 7%, almost mirroring the earnings CAGR.
The last two decades saw several phases and cycles in the Nifty where valuations have mean-reverted even as earnings drove long-term markets returns. Post the recent fall, the Nifty returns CAGR sinc..
Read More
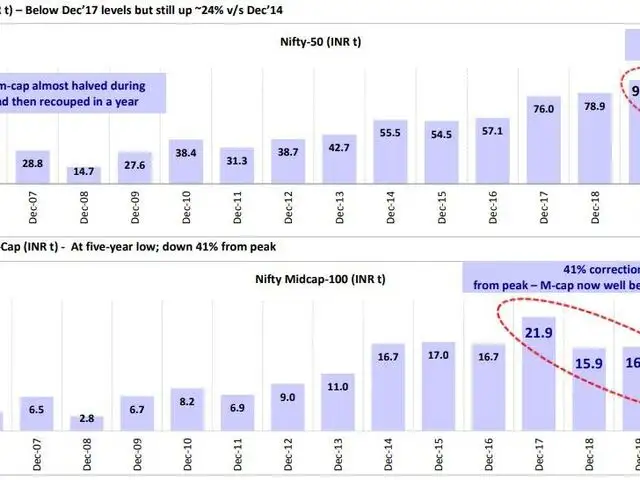
Nifty-50 market cap has corrected 23% from December 2019 levels and has now slipped below the December 2017 mark. The muted 4% CAGR since December 2014 is symptomatic of the tepid corporate earnings cycle. Nifty Midcap-100 market cap is down 41% from peak and 23% below December 2014 levels.
Nifty-50 market cap has corrected 23% from December 2019 levels and has now slipped below the December 2017 mark. The muted 4% CAGR since December 2014 is symptomatic of the tepid corporate earnings ..
Read More
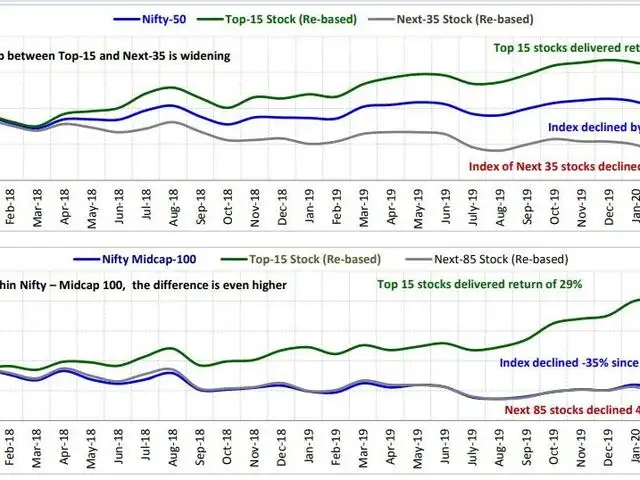
Market polarization has continued with Nifty top 15 gaining 10% and the other 35 Nifty constituents (Nifty-35) down 36% since December 2017. YTD, Nifty top 15 are down 24%, while the other 35 stocks have declined by 27%. The divide is starker in mid-caps. Since December 2017, Nifty Midcap-100 has corrected 35%, with the top 15 stocks delivering 29% gains but the remaining 85 stocks declining by 40%. YTD, the top 15 stocks are down 8%, while the other 85 stocks are down by 26%.
Market polarization has continued with Nifty top 15 gaining 10% and the other 35 Nifty constituents (Nifty-35) down 36% since December 2017. YTD, Nifty top 15 are down 24%, while the other 35 stocks ..
Read More
If history is to go by, markets usually rebound the most in 3-6 months post sharp corrections. Except one instance during the Tech meltdown of 2000, markets have delivered positive returns in the subsequent 12-month period. On an average, it takes about 156 days between peak to trough - the lowest has been 35 days in 2006 and the highest 410 days in Nov 2010-Dec 2011.
If history is to go by, markets usually rebound the most in 3-6 months post sharp corrections. Except one instance during the Tech meltdown of 2000, markets have delivered positive returns in the sub..
Read More
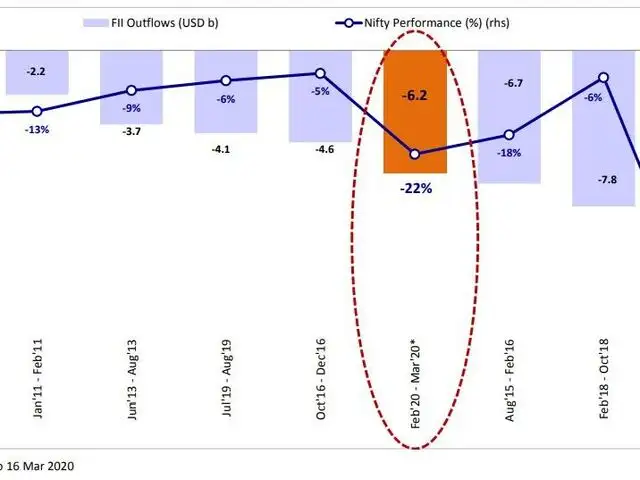
Sharp bout of FII outflow has often acted as a catalyst for significant market correction in a short period of time in the past. In the current episode, FIIs have offloaded $6.2b in less than a month with underlying market correction of 20%+.
Sharp bout of FII outflow has often acted as a catalyst for significant market correction in a short period of time in the past. In the current episode, FIIs have offloaded $6.2b in less than a month..
Read More
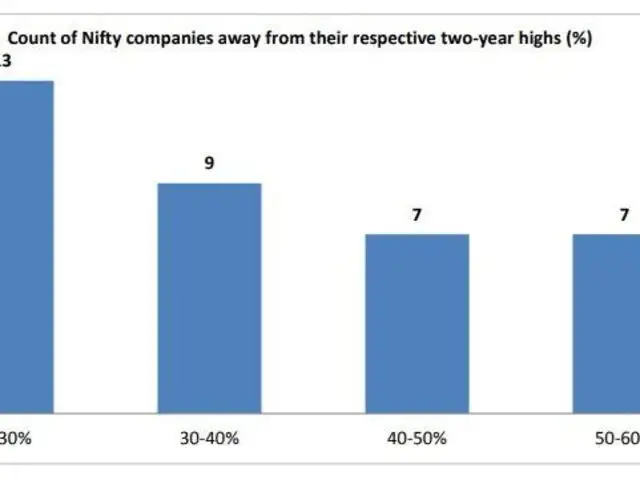
More than two fifths of the Nifty constituents are >40% down from their respective two-year highs, while 12% of companies are about <20% down from two-year highs. Companies closest to their two-year highs: APNT (12%), Nestle (15%), HUL (16%), Dr. Reddy (16%) and Bharti (18%).
More than two fifths of the Nifty constituents are >40% down from their respective two-year highs, while 12% of companies are about <20% down from two-year highs. Companies closest to their two-year ..
Read More
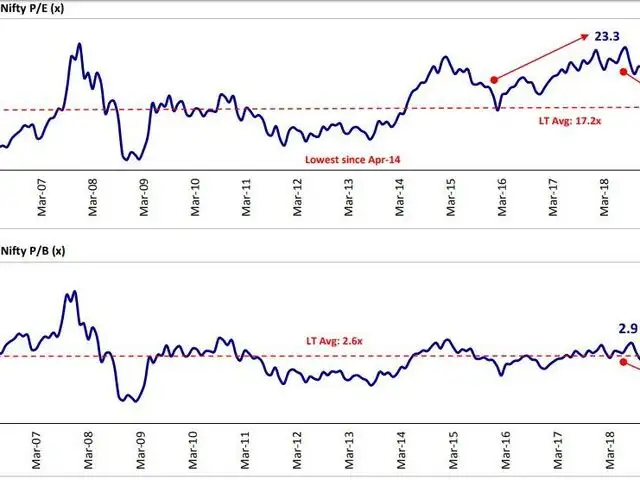
Nifty 12-month forward P/E of 15.1x is at a 12% discount to LT average of 17.2x (March 2005) and at levels last seen in February 2014. At 2.0x, the Nifty 12-month forward P/B is also well below the historical average of 2.6x. We have assumed a 10% cut in our FY21 Nifty earnings estimates to account for the disruption due to the global pandemic.
Nifty 12-month forward P/E of 15.1x is at a 12% discount to LT average of 17.2x (March 2005) and at levels last seen in February 2014. At 2.0x, the Nifty 12-month forward P/B is also well below the h..


 Market correction nearing its end; bet on banking, pharma: Rohit Srivastava2026-06-03T08:43:35Z
