
Market trading guide: Data Patterns among four stock recommendations for Wednesday

1/5
Stock Ideas
Nifty extended losses for the second consecutive session, falling 144 points to close at 23,625. After opening 36 points lower, the index remained under pressure throughout the day and finished near session lows. Analysts say the broader trend remains firmly bearish, with Nifty printing lower tops and lower bottoms while trading below key moving averages.
Here are four stock recommendations for Wednesday
Here are four stock recommendations for Wednesday

2/5
Data Patterns - Buy | Buying Zone: 4,930-4,940 | Stop-loss: Rs 4,730 | Target: Rs 5,300
Data Patterns (India) Limited has delivered a strong horizontal resistance breakout above the 4,900 level on the daily chart with a gain of 7.44%. Supported by perfectly stacked moving averages, a noticeable volume surge, and an RSI turning sharply upwards towards 60, the setup points towards immediate bullish continuation.
Virat Jagad, Sr Technical Research Analyst at Bonanza Portfolio
Virat Jagad, Sr Technical Research Analyst at Bonanza Portfolio

3/5
Kirloskar Oil Engines - Buy | Buying Zone: 2,270-2,280 | Stop-loss: Rs 2,160 | Target: Rs 2,490
Kirloskar Oil Engines has staged a fresh upward bounce off its short-term moving average support to test local resistance near 2,272 on the daily timeframe, up 4.51%. Backed by steady volume accumulation and a bullish RSI recovery out of oversold territory, the structure favours further tactical upside expansion.
Virat Jagad, Sr Technical Research Analyst at Bonanza Portfolio
Virat Jagad, Sr Technical Research Analyst at Bonanza Portfolio
Amazon Top Deals
POWERED BY

Crompton Ozone 75 Litres Desert Air Cooler for home | Large & Easy Clean Ice Chamber | 4-Way Air Deflection | High Density Honeycomb Pads | Everlast Pump | Auto Fill| 3 Year Brand Warranty
₹9,798Buy Now43%
OFF
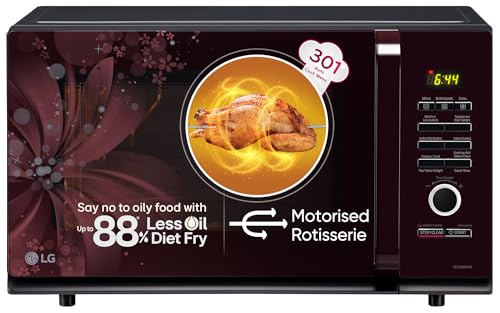
LG 32 L Convection Microwave Oven (MC3286BRUM, Black, 360° Motorised Rotisserie for Bar-be-queing, 301 Auto Cook Menu, Stainless steel cavity, Indian Cuisine, Tandoor Se, Steam Clean & Diet Fry)
₹19,090Buy Now20%
OFF

4/5
Granules India - Buy | Stop-loss: Rs 840 | Target: Rs 960
Granules India is showing a strong bullish setup, with the stock breaking out of a multi-week falling trendline/consolidation pattern. The breakout has seen a sharp move, supported by improving momentum and higher-than-recent-average volume. The stock has moved above the descending resistance line near 870-875, indicating a potential trend continuation after the recent consolidation. Price is comfortably above the short-, medium- and long-term moving averages. The short-term averages are also turning upwards, confirming improving price momentum.
Vaishali Patel, Senior Manager - Research, Technical Department at Jainam
Vaishali Patel, Senior Manager - Research, Technical Department at Jainam
5/5
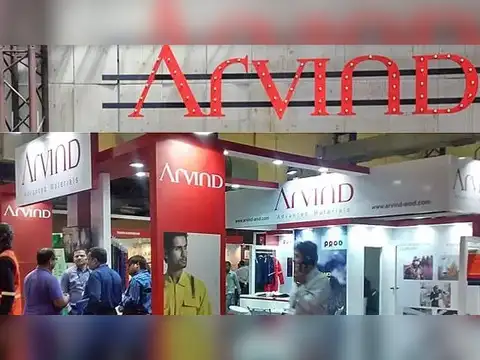
Arvind - Buy | Stop-loss: Rs 554 | Target: Rs 630
Arvind has given a bullish ascending triangle chart pattern breakout, indicating a potential shift towards a bullish setup. The stock is trading above its short- and medium-term moving averages, with the 550-555 zone emerging as immediate support. RSI has moved above 60, confirming improving momentum without entering an extreme overbought zone. Sustained trading above 575-580 can trigger further upside towards 600, followed by 620. On the downside, a close below 550 would weaken the breakout.
Vaishali Patel, Senior Manager - Research, Technical Department at Jainam
(This article has been written by Podishetti Akash, who is not a SEBI-registered Research Analyst or an investment advisor. Podishetti Akash does not hold any financial interest in the above as of the date of publication. The views/recommendations mentioned in this article, wherever applicable, are those of the respective SEBI-registered Research Analyst/brokerage and have been reproduced/reported with due attribution. They should not be construed as the views or recommendations of the Economic Times Digital or the journalist. Readers are advised to consider the original research report and make their investment decisions based on their own assessment. Brokerage disclosures here)
Vaishali Patel, Senior Manager - Research, Technical Department at Jainam
(This article has been written by Podishetti Akash, who is not a SEBI-registered Research Analyst or an investment advisor. Podishetti Akash does not hold any financial interest in the above as of the date of publication. The views/recommendations mentioned in this article, wherever applicable, are those of the respective SEBI-registered Research Analyst/brokerage and have been reproduced/reported with due attribution. They should not be construed as the views or recommendations of the Economic Times Digital or the journalist. Readers are advised to consider the original research report and make their investment decisions based on their own assessment. Brokerage disclosures here)