The rupee lurching from one low to another in the week gone by did unsettle investors on Dalal Street. But benchmark indices Sensex and Nifty finally kept their cool, signing off the week with a smile.
For the week, the Sensex notched up 79 points, or 0.21 per cent, settling at 37,948. The Nifty made a new home with a record high of 11,471, up 41.25 points, or 0.35 per cent, against a close of 11,430 on August 10.
A look at the top stocks that you can go with the week ahead.
ET Intelligence Group: Within five months of its listing, Bandhan Bank’s stock has shot up by 87 per cent from its offer price of Rs 375, taking its market capitalisation closer to Yes Bank, whose loan book is six times larger and total income fourand-a-half times more.
The sharp jump on the bourses has also made Bandhan Bank the costliest banking stock in terms of price-book (P/B) ratio among the top 10 banks based on the market capitalisation.
On Friday, Bandhan Bank’s market capitalisation was Rs 83,878 crore making it the country’s eighth largest bank. Yes Bank, the seventh largest bank, had market cap of Rs 90,628 crore.
At the price of Rs 703.2 on the BSE, Bandhan’s stock was traded at a trailing P/B of 8.9. The P/B of private sector banks in the top 10 list was 2.5-5.1 while that of the public sector banks was 0.9-1.4. HDFC Bank, the country’s largest bank based on market capitalisation had P/B of 5.1.
Bandhan’s premium valuation reflects its impressive return ratios and better asset quality. It had the highest return on assets (RoA) of 4 per cent in FY18 compared with an RoA of under two for rest of the banks in the top 10 list. Its gross non-performing assets (GNPA) ratio at 1.25 per cent was also the lowest in the sample.
ADVERTISEMENT
Bandhan Bank had total income of Rs 5,508 crore and total advances of Rs 32,339 crore in FY18. On each of these parameters, it was the smallest bank in the sample.
Analysts have a positive view on the stock. The Bloomberg consensus rating shows that five out of six analysts covering the bank had a “buy” call while one had a “hold” call on the stock.
“We believe Bandhan remains a strong compounding story with a play on vast rural opportunity, with best-in-class return metrics and strong operating efficiencies. Bandhan will continue to trade at premium valuations as investors acknowledge the structural growth opportunity and sustainability of return metrics,” mentioned brokerage JM Financial Institutional Securities in a recent report.
5 stocks on which tech charts show 'BUY' signal
1/6
The rupee lurching from one low to another in the week gone by did unsettle investors on Dalal Street. But benchmark indices Sensex and Nifty finally kept their cool, signing off the week with a smile.
For the week, the Sensex notched up 79 points, or 0.21 per cent, settling at 37,948. The Nifty made a new home with a record high of 11,471, up 41.25 points, or 0.35 per cent, against a close of 11,430 on August 10.
A look at the top stocks that you can go with the week ahead.
The rupee lurching from one low to another in the week gone by did unsettle investors on Dalal Street. But benchmark indices Sensex and Nifty finally kept their cool, signing off the week with a smil..
Read More
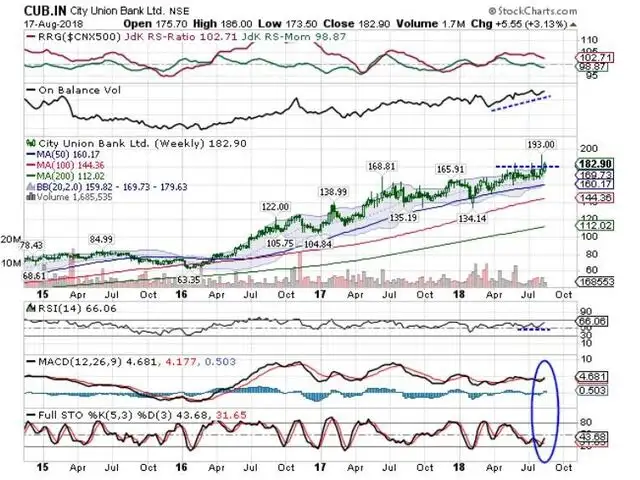
The stock has been under secular uptrend over past two years. Currently highs in the 188-193 zones, the stock has been consolidating in a sideways move over past couple of weeks. The prices have attempted a breakout and is set to assume its up move again.
The Weekly MACD has reported a positive crossover and it is now bullish while trading above its signal line. A buy signal has also emerged on the Weekly Charts over Stochastic with a positive divergence against the price. On-Balance Volume – OBV has also marked afresh high which is bullish. RSI is seen breaking out of a formation and we can see the prices marking higher levels over coming days. Any move below 170 will be negative for the stock
The stock has been under secular uptrend over past two years. Currently highs in the 188-193 zones, the stock has been consolidating in a sideways move over past couple of weeks. The prices have atte..
Read More
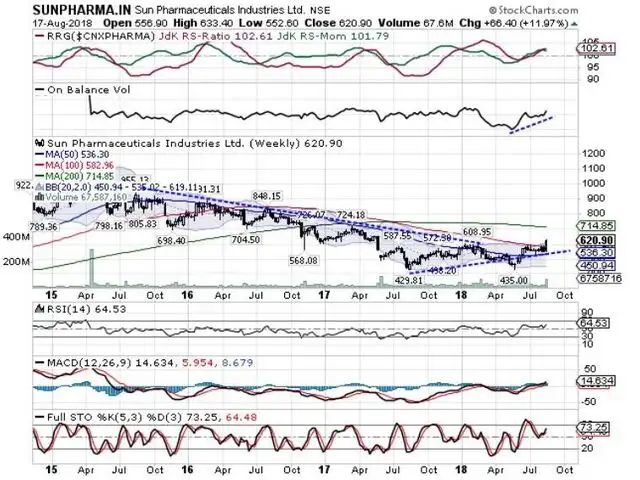
The stock has remained in a prolonged downtrend and is now seen attempting and subsequently confirming a reversal. The downward channel that begin from 1100-1150 zones saw itself being converted into broad accumulation zone between 450-500 levels.
Weekly MACD stays in continuing buy mode while Weekly RSI has marked a fresh 14-period high. It is also seen marking a breakout from a pattern. The prices have ended above the upper Bollinger band and a breakout is likely. Though a temporary pullback inside the band cannot be ruled, up move in prices is most likely to continue. The Stock remains in the leading quadrant on RRG when benchmarked against the Pharma Index which in turn remains in the leading quadrant as well on RRG. Any move below 590 will be negative for the stock.
The stock has remained in a prolonged downtrend and is now seen attempting and subsequently confirming a reversal. The downward channel that begin from 1100-1150 zones saw itself being converted into..
Read More
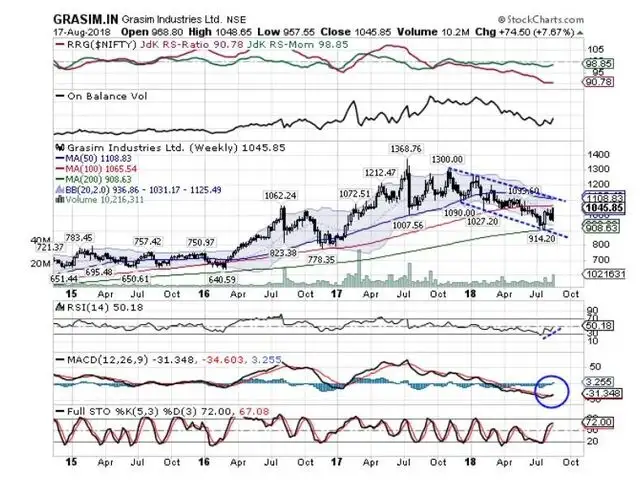
The stock marked its high at 1368 and thereafter marked a lower top at 1300. After that, it has remained under a corrective downward falling channel. After marking lows around 900-915 levels, few signals have emerged which point toward likely resumption of an up move in prices.
The Weekly MACD has reported a positive crossover and it is now bullish while trading above its signal line. The Weekly RSI has also marked its fresh 14-period high which is bullish. RSI is also seen marking a higher bottom and breaking out of a pattern showing a bullish divergence against the price. An Engulfing Bullish Candle has emerged. This holds significance as it has occurred after some sustained corrective downtrend. Upward revision in prices cannot be ruled out over coming days. Any move below 975 will be negative for the stock.
The stock marked its high at 1368 and thereafter marked a lower top at 1300. After that, it has remained under a corrective downward falling channel. After marking lows around 900-915 levels, few sig..
Read More
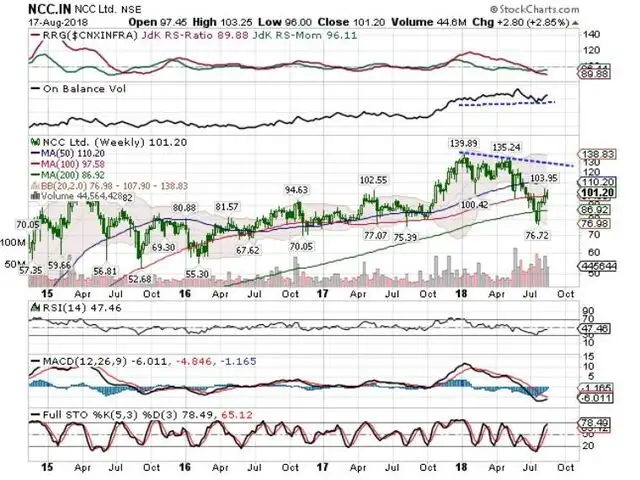
The stock tested its high at 139.80 and then formed a minor lower top at 135. Thereafter, it has witnessed a sharp corrective decline which saw the stock testing the 76-78 levels. A potential base has been formed around those levels as the stock has witnessed a technical pullback. We expected this pullback to continue. The lows were tested with exponential volumes and this may mean that the stock has find its potential bottom.
Weekly MACD is sharply moving toward reporting a positive crossover. Weekly RSI is neutral and is seen rebounding from the oversold area. RSI is also seen moving out from a falling channel pattern. With some consolidation likely, continuation of a pullback cannot be ruled out. Any move below 94 will be negative for the stock.
The stock tested its high at 139.80 and then formed a minor lower top at 135. Thereafter, it has witnessed a sharp corrective decline which saw the stock testing the 76-78 levels. A potential base ha..
Read More
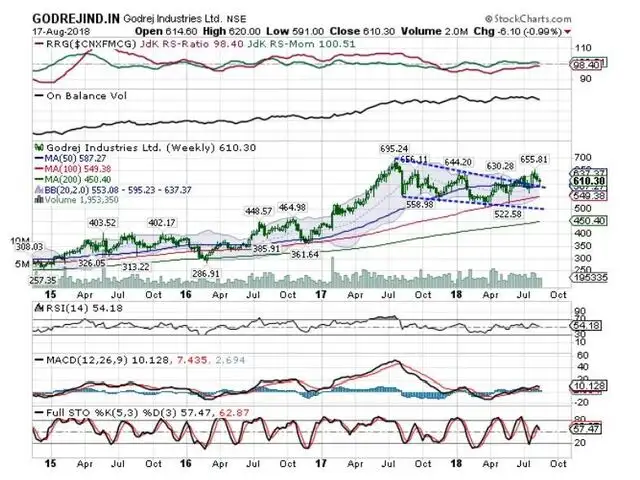
The stock gave a breakout on the upside after breaking out from a downward corrective channel. This channel was formed when the stock entered a corrective phase and remained under broad consolidation. Weekly MACD continues to remain in a continuing buy mode.
Weekly RSI remains neutral and is seen marking higher bottoms. The stock suffered a classical throwback post the breakout and is now seen attempting to resume its up move. A candle with a long lower shadow emerged after a throwback occurred. It remains significant as it emerged near the support level of 50-wMA.
We may see stock seeing upward revision in prices over coming days. Any move below 575 will be negative for the stock.
The stock gave a breakout on the upside after breaking out from a downward corrective channel. This channel was formed when the stock entered a corrective phase and remained under broad consolidation..
The rupee lurching from one low to another in the week gone by did unsettle investors on Dalal Street. But benchmark indices Sensex and Nifty finally kept their cool, signing off the week with a smile.
For the week, the Sensex notched up 79 points, or 0.21 per cent, settling at 37,948. The Nifty made a new home with a record high of 11,471, up 41.25 points, or 0.35 per cent, against a close of 11,430 on August 10.
A look at the top stocks that you can go with the week ahead.
The rupee lurching from one low to another in the week gone by did unsettle investors on Dalal Street. But benchmark indices Sensex and Nifty finally kept their cool, signing off the week with a smil..
Read More
The stock has been under secular uptrend over past two years. Currently highs in the 188-193 zones, the stock has been consolidating in a sideways move over past couple of weeks. The prices have attempted a breakout and is set to assume its up move again.
The Weekly MACD has reported a positive crossover and it is now bullish while trading above its signal line. A buy signal has also emerged on the Weekly Charts over Stochastic with a positive divergence against the price. On-Balance Volume – OBV has also marked afresh high which is bullish. RSI is seen breaking out of a formation and we can see the prices marking higher levels over coming days. Any move below 170 will be negative for the stock
The stock has been under secular uptrend over past two years. Currently highs in the 188-193 zones, the stock has been consolidating in a sideways move over past couple of weeks. The prices have atte..
Read More
The stock has remained in a prolonged downtrend and is now seen attempting and subsequently confirming a reversal. The downward channel that begin from 1100-1150 zones saw itself being converted into broad accumulation zone between 450-500 levels.
Weekly MACD stays in continuing buy mode while Weekly RSI has marked a fresh 14-period high. It is also seen marking a breakout from a pattern. The prices have ended above the upper Bollinger band and a breakout is likely. Though a temporary pullback inside the band cannot be ruled, up move in prices is most likely to continue. The Stock remains in the leading quadrant on RRG when benchmarked against the Pharma Index which in turn remains in the leading quadrant as well on RRG. Any move below 590 will be negative for the stock.
The stock has remained in a prolonged downtrend and is now seen attempting and subsequently confirming a reversal. The downward channel that begin from 1100-1150 zones saw itself being converted into..
Read More
The stock marked its high at 1368 and thereafter marked a lower top at 1300. After that, it has remained under a corrective downward falling channel. After marking lows around 900-915 levels, few signals have emerged which point toward likely resumption of an up move in prices.
The Weekly MACD has reported a positive crossover and it is now bullish while trading above its signal line. The Weekly RSI has also marked its fresh 14-period high which is bullish. RSI is also seen marking a higher bottom and breaking out of a pattern showing a bullish divergence against the price. An Engulfing Bullish Candle has emerged. This holds significance as it has occurred after some sustained corrective downtrend. Upward revision in prices cannot be ruled out over coming days. Any move below 975 will be negative for the stock.
The stock marked its high at 1368 and thereafter marked a lower top at 1300. After that, it has remained under a corrective downward falling channel. After marking lows around 900-915 levels, few sig..
Read More
The stock tested its high at 139.80 and then formed a minor lower top at 135. Thereafter, it has witnessed a sharp corrective decline which saw the stock testing the 76-78 levels. A potential base has been formed around those levels as the stock has witnessed a technical pullback. We expected this pullback to continue. The lows were tested with exponential volumes and this may mean that the stock has find its potential bottom.
Weekly MACD is sharply moving toward reporting a positive crossover. Weekly RSI is neutral and is seen rebounding from the oversold area. RSI is also seen moving out from a falling channel pattern. With some consolidation likely, continuation of a pullback cannot be ruled out. Any move below 94 will be negative for the stock.
The stock tested its high at 139.80 and then formed a minor lower top at 135. Thereafter, it has witnessed a sharp corrective decline which saw the stock testing the 76-78 levels. A potential base ha..
Read More
The stock gave a breakout on the upside after breaking out from a downward corrective channel. This channel was formed when the stock entered a corrective phase and remained under broad consolidation. Weekly MACD continues to remain in a continuing buy mode.
Weekly RSI remains neutral and is seen marking higher bottoms. The stock suffered a classical throwback post the breakout and is now seen attempting to resume its up move. A candle with a long lower shadow emerged after a throwback occurred. It remains significant as it emerged near the support level of 50-wMA.
We may see stock seeing upward revision in prices over coming days. Any move below 575 will be negative for the stock.
The stock gave a breakout on the upside after breaking out from a downward corrective channel. This channel was formed when the stock entered a corrective phase and remained under broad consolidation..


 Stock Radar: Bandhan Bank stock takes support above 50-DMA; time to buy?
