12 stock ideas from top analysts that can deliver gains in 3 weeks
Experts believe with March quarter earnings largely below estimates.
By ETMarkets.com | Updated:

ThinkStock Photos
NEW DELHI: As we enter the F&O expiry week, trading is expected to turn volatile on Dalal Street.
Although the bulls have managed to hold an upper hand during the week gone by owing to a sharp recovery in the rupee and a fall in crude prices, the road ahead does not seem that smooth.
Experts believe with March quarter earnings largely below estimates, FY19 estimates are likely to be downgraded. Decelerating macros like rising bond yields, a spike in inflation, rupee depreciation and widening current account deficit (CAD) might impact market performance over the medium term, says Vinod Nair, Head of Research at Geojit Financial Services.
"This will lower the premium valuation of India, which is currently at a one-year forward premium of 18 times, compared with the long-term average of 15 times. Some respite can be expected if RBI steps in to curb the steep fall in the rupee,” Nair said.
On a weekly basis, the Nifty50 gained 0.08 per cent while the 30-share Sensex of BSE added 0.21 per cent. Among the sectoral gainers, the Nifty Metal index rose over 2 per cent and Nifty Auto index 1 per cent.
Based on various brokerage recommendations, here are 12 stock strategies that can potentially deliver good gains over the next three weeks.
Vinay Rajani, Technical Research Analyst at HDFC Securities
Tata Sponge | BUY | Target Price: Rs 1,160 | Stop loss: Rs 1,065
The stock price has broken out of a downward sloping channel with a significant jump in volumes on the daily chart. It has been holding above its long-term moving averages of 50- and 200-DMAs. The primary trend of the stock is bullish and the oscillators indicate a trend reversal from current levels.
Sterlite Technologies | BUY | Target Price: Rs 345 | Stop loss: Rs 305
This stock witnessed a fall of more than 27 per cent from the January 2018 high and turned extremely oversold on the medium-term charts. The 200-DMA acted as a support and trend reversed northward recently. On Friday, it closed at a five-day high with rise in volumes, indicating a bullish reversal for the short term.
Federal Bank | BUY | Target Price: Rs 92 | Stop loss: Rs 79
Albeit this counter has hugely disappointed with a big downward gap post March quarter earnings, it appears to have has bottomed out around the recent lows of Rs 80. As this counter made a decent base around Rs 80 and appears to be making an attempt to resume its upward move, it can be expected to test the gap-down zone of Rs 93 to Rs 98 on such a recovery. Hence, positional traders are advised to go long with a stop of Rs 79 for a initial target of Rs 92.
Interestingly, this counter appears to have bottomed out a week ahead of the market, as it was moving almost horizontally for last 5 trading sessions and appears to have made a decent base around Rs 111. From this cushion it can easily head to test its 200-day moving average, whose value is placed around Rs 128 level.
DLF | BUY | Target Price: Rs 220 | Stop loss: Rs 190
This counter appears to have bottomed out after testing the downsloping trendline support drawn by connecting recent lows of February and March. Hence, on resumption of the upward move from the said support level, it can be expected to extend its upswing towards the Rs 220 level.
Swati A Hotkar, Sr. Equity Technical Analyst - Research, Nirmal Bang Securities
Siemens | BUY | Target Price: Rs 1,120 | Stop loss: Rs 1,010
The daily chart indicates that after a sharp fall from Rs 1,154 to Rs 1,010 level, the stock has managed to hold the support of Rs 1,010. Looking towards the technical setup, pull back rally may be seen towards the Rs 1,120 level.
Equitas Holdings | BUY | Target Price: Rs 170 | Stop loss: Rs 152
The daily line chart indicates that the stock has taken a strong support of 50-DMA and has shown a sign of reversal signalling positive view. It is trading in higher tops and higher bottom pattern which indicates potential bounce.
Suven Life Sciences | BUY | Target Price: Rs 204 | Stop loss: Rs 182
The weekly chart indicates that the stock is forming a Pennant pattern and it’s on the verge of giving an upward breakout from the trend line, giving a positive signal. Momentum indicators such as RSI shows positive crossover.
Vaishali Parekh, Research Analyst, Technical Research, Prabhudas Lilladher
YES Bank | BUY | Target Price: Rs 370 | Stop loss: Rs 325
The stock has seen a short correction from the peak of Rs 369 to bottom out around the Rs 325 level and taking support at the significant 200-DMA level. It has made the chart look attractive to anticipate a bounce from here on. With the positive bullish candle pattern formed in the daily chart and also with the RSI indicator showing a trend reversal to signal a buy, the stock is poised for further rise from here on and the risk reward ratio has become favourable.
Apollo Tyres | BUY | Target Price: Rs 300 | Stop loss: Rs 269
This stock has been consolidating at around Rs 274 level and has produced a positive bullish candle pattern in the daily chart to signify strength and potential to rise further in the coming days. It has maintained above the 200-DMA moving average and has indicated a positive bias. RSI showing a trend reversal indicates a buy signal.
Milan Vaishnav, CMT, MSTA
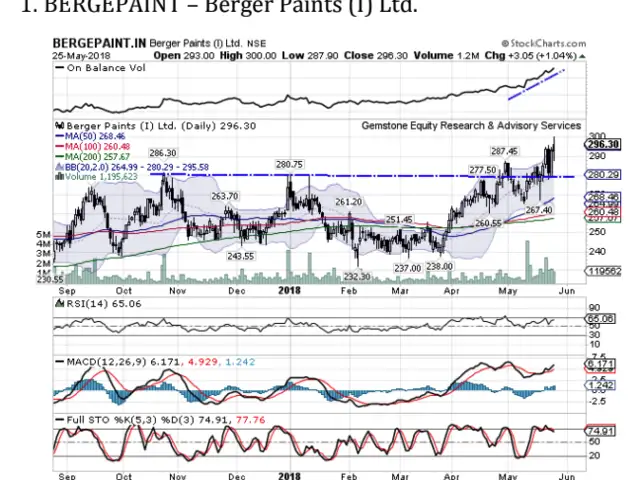
Berger Paints | BUY | Target Price: Rs 310 | Stop loss: Rs 285
The stock tested multiple resistance area from Rs 280-286 zone and has attempted to break out. It had suffered a temporary throwback but has attempted to resume its bounce again. The price has closed above upper Bollinger Band on both Daily and Weekly Charts and it suggests that though some temporary pullback inside the band cannot be ruled out, an upward breakout is possible. The Weekly RSI has marked a fresh 14-period high which is bullish. Some upward revision in price cannot be ruled out over the coming days. On-Balance Volume has scaled a fresh high which is again bullish.
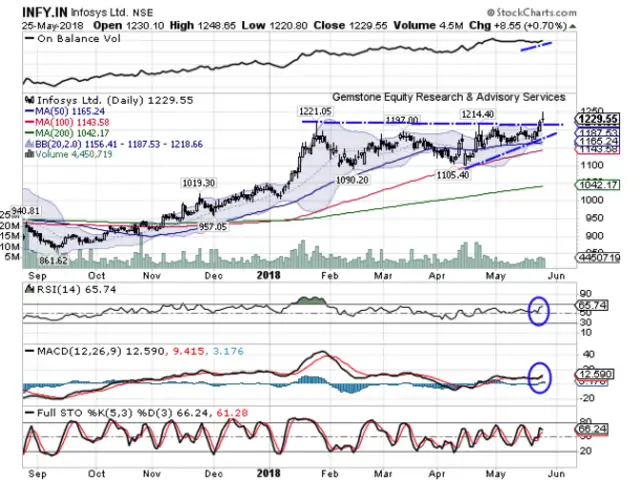
Infosys | BUY | Target Price: Rs 1,275 | Stop loss: Rs 1,195
After a prolonged consolidation and trading in a capped range, the stock had created multiple resistances in the Rs 1,200 - 1,221 range. It has seen an attempt to breakout from that range. The daily MACD stays in continuing buy mode. The weekly MACD is seen moving sharply towards positive crossover over coming days. The RSI is seen breaking out of a formation and has marked a fresh 14-period high which is bullish. The prices have ended above upper Bollinger band which further increases the possibility of breakout occurring over the coming days.
(Views and recommendations given in this article are the analysts’ own and do not represent those of ETMarkets.com. Please consult your financial adviser before taking any position in the stock/s mentioned.)

Although the bulls have managed to hold an upper hand during the week gone by owing to a sharp recovery in the rupee and a fall in crude prices, the road ahead does not seem that smooth.
Experts believe with March quarter earnings largely below estimates, FY19 estimates are likely to be downgraded. Decelerating macros like rising bond yields, a spike in inflation, rupee depreciation and widening current account deficit (CAD) might impact market performance over the medium term, says Vinod Nair, Head of Research at Geojit Financial Services.
"This will lower the premium valuation of India, which is currently at a one-year forward premium of 18 times, compared with the long-term average of 15 times. Some respite can be expected if RBI steps in to curb the steep fall in the rupee,” Nair said.
On a weekly basis, the Nifty50 gained 0.08 per cent while the 30-share Sensex of BSE added 0.21 per cent. Among the sectoral gainers, the Nifty Metal index rose over 2 per cent and Nifty Auto index 1 per cent.
Based on various brokerage recommendations, here are 12 stock strategies that can potentially deliver good gains over the next three weeks.
ADVERTISEMENT
Vinay Rajani, Technical Research Analyst at HDFC Securities
Tata Sponge | BUY | Target Price: Rs 1,160 | Stop loss: Rs 1,065
The stock price has broken out of a downward sloping channel with a significant jump in volumes on the daily chart. It has been holding above its long-term moving averages of 50- and 200-DMAs. The primary trend of the stock is bullish and the oscillators indicate a trend reversal from current levels.
Sterlite Technologies | BUY | Target Price: Rs 345 | Stop loss: Rs 305
This stock witnessed a fall of more than 27 per cent from the January 2018 high and turned extremely oversold on the medium-term charts. The 200-DMA acted as a support and trend reversed northward recently. On Friday, it closed at a five-day high with rise in volumes, indicating a bullish reversal for the short term.
ADVERTISEMENT
Mazhar Mohammad, Chief Strategist – Technical Research & Trading Advisory, Chartviewindia.inFederal Bank | BUY | Target Price: Rs 92 | Stop loss: Rs 79
Albeit this counter has hugely disappointed with a big downward gap post March quarter earnings, it appears to have has bottomed out around the recent lows of Rs 80. As this counter made a decent base around Rs 80 and appears to be making an attempt to resume its upward move, it can be expected to test the gap-down zone of Rs 93 to Rs 98 on such a recovery. Hence, positional traders are advised to go long with a stop of Rs 79 for a initial target of Rs 92.
ADVERTISEMENT
NMDC | BUY | Target Price: Rs 127 | Stop loss: Rs 110Interestingly, this counter appears to have bottomed out a week ahead of the market, as it was moving almost horizontally for last 5 trading sessions and appears to have made a decent base around Rs 111. From this cushion it can easily head to test its 200-day moving average, whose value is placed around Rs 128 level.
DLF | BUY | Target Price: Rs 220 | Stop loss: Rs 190
This counter appears to have bottomed out after testing the downsloping trendline support drawn by connecting recent lows of February and March. Hence, on resumption of the upward move from the said support level, it can be expected to extend its upswing towards the Rs 220 level.
Swati A Hotkar, Sr. Equity Technical Analyst - Research, Nirmal Bang Securities
Siemens | BUY | Target Price: Rs 1,120 | Stop loss: Rs 1,010
The daily chart indicates that after a sharp fall from Rs 1,154 to Rs 1,010 level, the stock has managed to hold the support of Rs 1,010. Looking towards the technical setup, pull back rally may be seen towards the Rs 1,120 level.
Equitas Holdings | BUY | Target Price: Rs 170 | Stop loss: Rs 152
The daily line chart indicates that the stock has taken a strong support of 50-DMA and has shown a sign of reversal signalling positive view. It is trading in higher tops and higher bottom pattern which indicates potential bounce.
Suven Life Sciences | BUY | Target Price: Rs 204 | Stop loss: Rs 182
The weekly chart indicates that the stock is forming a Pennant pattern and it’s on the verge of giving an upward breakout from the trend line, giving a positive signal. Momentum indicators such as RSI shows positive crossover.
Vaishali Parekh, Research Analyst, Technical Research, Prabhudas Lilladher
YES Bank | BUY | Target Price: Rs 370 | Stop loss: Rs 325
The stock has seen a short correction from the peak of Rs 369 to bottom out around the Rs 325 level and taking support at the significant 200-DMA level. It has made the chart look attractive to anticipate a bounce from here on. With the positive bullish candle pattern formed in the daily chart and also with the RSI indicator showing a trend reversal to signal a buy, the stock is poised for further rise from here on and the risk reward ratio has become favourable.
Apollo Tyres | BUY | Target Price: Rs 300 | Stop loss: Rs 269
This stock has been consolidating at around Rs 274 level and has produced a positive bullish candle pattern in the daily chart to signify strength and potential to rise further in the coming days. It has maintained above the 200-DMA moving average and has indicated a positive bias. RSI showing a trend reversal indicates a buy signal.
Milan Vaishnav, CMT, MSTA
Berger Paints | BUY | Target Price: Rs 310 | Stop loss: Rs 285
The stock tested multiple resistance area from Rs 280-286 zone and has attempted to break out. It had suffered a temporary throwback but has attempted to resume its bounce again. The price has closed above upper Bollinger Band on both Daily and Weekly Charts and it suggests that though some temporary pullback inside the band cannot be ruled out, an upward breakout is possible. The Weekly RSI has marked a fresh 14-period high which is bullish. Some upward revision in price cannot be ruled out over the coming days. On-Balance Volume has scaled a fresh high which is again bullish.
Infosys | BUY | Target Price: Rs 1,275 | Stop loss: Rs 1,195
After a prolonged consolidation and trading in a capped range, the stock had created multiple resistances in the Rs 1,200 - 1,221 range. It has seen an attempt to breakout from that range. The daily MACD stays in continuing buy mode. The weekly MACD is seen moving sharply towards positive crossover over coming days. The RSI is seen breaking out of a formation and has marked a fresh 14-period high which is bullish. The prices have ended above upper Bollinger band which further increases the possibility of breakout occurring over the coming days.
(Views and recommendations given in this article are the analysts’ own and do not represent those of ETMarkets.com. Please consult your financial adviser before taking any position in the stock/s mentioned.)
Headline indices Sensex and Nifty shut shop with sharp gains on Friday. The S&P BSE Sensex gained 262 points to close at 34,925, while the 50-share pack of NSE closed above the crucial 10,600 level at 10,605, up 91 points or 0.87 per cent. On a weekly basis, the 50-share pack gained 0.08 per cent while the 30-share Sensex added 0.21 per cent.
Here's a look at the top five stocks which are likely to gain in the coming week.

Too busy to trade in stocks? Invest in Mutual Funds with ET Money!
Bookmark or read stories offline -
Download ET Markets APP
Download ET Markets APP
ADVERTISEMENT

