10 stocks that brokerages say can deliver good returns in 2-3 weeks
Market may witness buying as long as the 10,900 level is not breached on the downside.
By ETMarkets.com | Updated:

Getty Images
Nifty50 managed to hold the psychologically important 11,000 mark last week despite over half-a-per cent drop amid mixed macroeconomic data and rising concerns over global slowdown.
During the week, the index hit an intraday high and low of 10,901 and 11,145, respectively. Brokerage Stewart & Mackertich believes the market may witness buying as long as the 10,900 level is not breached on the downside.
Ending of the last session of the week with a Dragofly Doji pattern amid the ongoing mayhem can be a strong signal for aggressive bulls, the brokerage said in a note.
The index closed 0.17 per cent higher at 11,047 on Friday.
Based on recommendations from various analysts and brokerages, here are 10 stocks that analysts say should deliver gains over the next two to three weeks.
Milan Vaishnav, Gemstone Equity Research and Advisory
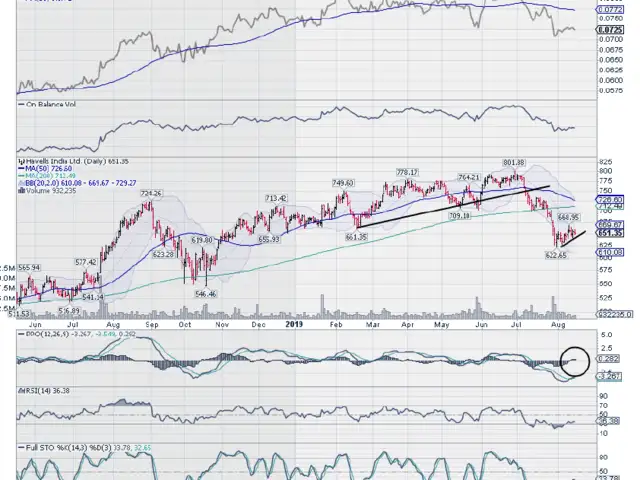
The stock recently witnessed a sharp correction from the high point of Rs 801. After briefly taking support at the 200-DMA, the stock slipped further down. A base formation was observed in the Rs 622-630 range. The stock may see a technical pullback from its current level for a target of Rs 712. The daily MACD has seen a positive crossover, and it is trading above the signal line. A new buy signal was seen on the Stochastic on the weekly charts. There are chances that the stock might see some upward momentum in the coming days. A close below Rs 610 should be treated as stop loss for this trade.
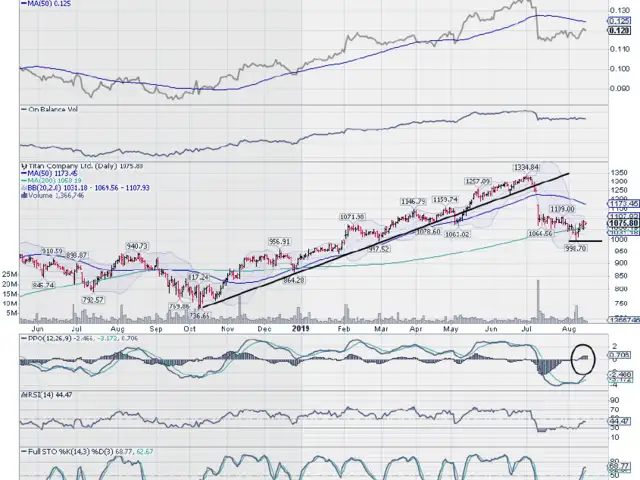
Titan | Buy | Target price: Rs 1,165 | CMP: Rs 1,075
The stock recently ended its nine-month secular upmove and breached its critical support at 200-DMA last week. After correcting from the highs of Rs 1,334, some attempt to form a short-term base is seen near the Rs 998 level. Now, the stock has pulled back from there and managed to crawl back above the 200-DMA, which currently stands at Rs 1,058. The daily MACD remains in ‘buy’ mode while the stochastic has shown a fresh ‘buy’ signal with a bullish divergence against price on the weekly charts. The pullback is likely to continue over the coming days. Any close below Rs 998 should be a stop loss for this trade.
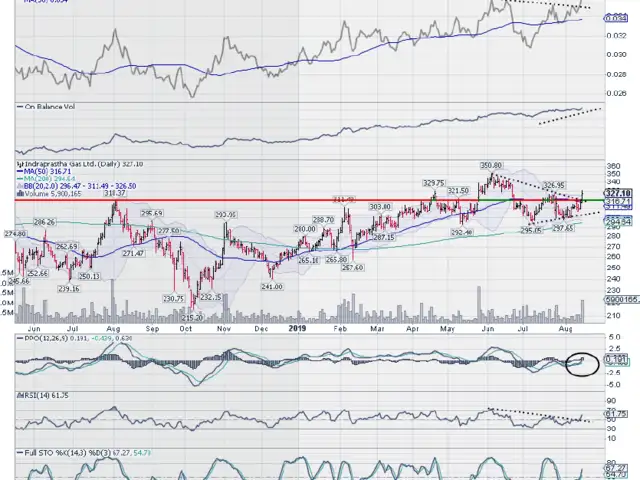
Indraprastha Gas (IGL) | Buy | Target price: Rs 355 | CMP: 327
This stock is seen breaking out of a formation after moving above its long-term support-resistance line seen on the charts. As this breakout was taking place, the OBV or On Balance Volume, marked a fresh high, which acts as a confirmation on the volume front. The RS Line, which shows the stock’s relative performance against the broader market, has broken out of a pattern and remained above its 50-DMA. The stock has closed above its upper Bollinger Band. Though a minor pullback inside the bands cannot be ruled out, there is a high possibility that the upward momentum may continue on the counter.

Mazhar Mohammad, Chartviewindia
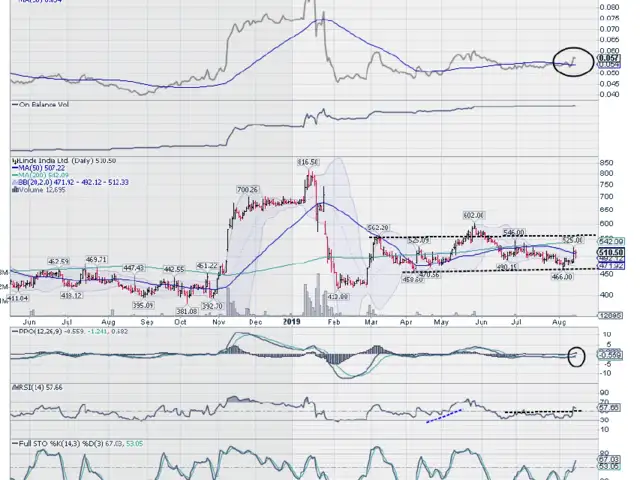
This counter appears to be on a consolidation mode after retracing 62 per cent of its last leg of rally from Rs 557-624 levels with a possible higher bottom around the recent low of Rs 579. Hence, if this counter resumes its bounce, then the initial hurdle can be around Rs 624 level, but once it manages to get past the said level, the Rs 641 level can’t be ruled out. Positional traders are advised to buy now and add further on declines between Rs 590 and Rs 585 levels and look for a bigger target at Rs 641. The stop loss suggested for this trade would be a close below Rs 578 level.
Ashok Leyland | Buy | Target price: Rs 73 | CMP: Rs 64
For last eight trading sessions, this counter consolidated in the narrow range of Rs 65-60 levels. This consolidation resulted in a ‘Hammer’ formation with long lower shadows on the weekly chart for last two weeks . Hence, traders can call a bottom with higher degree of confidence around Rs 60 for this counter. Positional traders are advised to make use of this opportunity to buy into this counter and look for a target of Rs 73. The stop loss suggested for this trade is a close below Rs 59.
Marico | Buy | Target price: Rs 425 | CMP: Rs 392
This stock is trading near its lifetime high with a positive momentum and is likely to make a new high in the coming weeks as it saw a bullish breakout sometime back. Momentum indicators like MACD and KST are placed with a positive sign, which could keep the momentum intact. The price has been forming higher highs and lows in all the degrees, which is a bullish continuation structure. In addition, the stock is trading above all its key moving averages. Traders may look to buy the stock at CMP and add on dips to Rs 380 for an upside target of Rs 425 over the next two-three weeks. Place a stop loss at Rs 372 on a closing basis.
IDFC First Bank | Buy | Target price: Rs 50 | CMP: Rs 46
This stock has formed a higher top and bottom formation on the weekly chart, which is a bullish Dow formation. The stock price has validated the previous week’s Engulfing bull formation, which confirms a bullish reversal. Technical indicators MACD and RSI are placed with a positive sign, which could add strength to the positive momentum. Traders may look to buy the stock at the CMP and add on dips to Rs 44 for an upside target of Rs 50 over the next 2-3 weeks. Place a stop loss at Rs 43 on a closing basis.
Jay Thakkar, Anand Rathi Shares and Stock Brokers
Apollo Hospitals | Buy | Target price: Rs 1,570 | CMP: Rs 1,471
This stock has seen a breakout from the sideways channel, which was formed in its Wave 4 and Wave 5 up, seems to have started. Volumes have increased with this breakout and the momentum indicator MACD has also provided a buy crossover.
Bata | Buy | Target price: Rs 1,540 |CMP: Rs 1,474
This stock has seen a breakout from the sideways channel with a clear ‘buy’ crossover in the momentum indicator. With this breakout, it seems that the index has completed its Wave 4 consolidation and Wave 5 up seems to have started.
Sameet Chavan, Angel Broking
Maruti Suzuki | Buy | Target price: Rs 6,300 | CMP: Rs 5,975
Our strategy at this juncture would be to target a few marquee names that have been correcting since last many months and have reached their crucial supports on higher degree time frame charts. This automobile giant is clearly one of them. The market recently saw confirmation of a ‘Bullish Hammer’ pattern formed around the golden ratio (161 per cent) of the previous up move. There were some encouraging moves seen from the intra-week lows and hence, we expect further relief in this counter. Traders can look to initiate longs for a target of Rs 6,300 and the stop loss should be fixed at Rs 5,750.

(Views and recommendations given in this section are the analysts’ own and do not represent those of ETMarkets.com. Please consult your financial adviser before taking any position in the stock/s mentioned.)
During the week, the index hit an intraday high and low of 10,901 and 11,145, respectively. Brokerage Stewart & Mackertich believes the market may witness buying as long as the 10,900 level is not breached on the downside.
Ending of the last session of the week with a Dragofly Doji pattern amid the ongoing mayhem can be a strong signal for aggressive bulls, the brokerage said in a note.
The index closed 0.17 per cent higher at 11,047 on Friday.
Based on recommendations from various analysts and brokerages, here are 10 stocks that analysts say should deliver gains over the next two to three weeks.
Milan Vaishnav, Gemstone Equity Research and Advisory
ADVERTISEMENT
Havells India | Buy | Target price: Rs 712 | CMP: Rs 650The stock recently witnessed a sharp correction from the high point of Rs 801. After briefly taking support at the 200-DMA, the stock slipped further down. A base formation was observed in the Rs 622-630 range. The stock may see a technical pullback from its current level for a target of Rs 712. The daily MACD has seen a positive crossover, and it is trading above the signal line. A new buy signal was seen on the Stochastic on the weekly charts. There are chances that the stock might see some upward momentum in the coming days. A close below Rs 610 should be treated as stop loss for this trade.
Titan | Buy | Target price: Rs 1,165 | CMP: Rs 1,075
The stock recently ended its nine-month secular upmove and breached its critical support at 200-DMA last week. After correcting from the highs of Rs 1,334, some attempt to form a short-term base is seen near the Rs 998 level. Now, the stock has pulled back from there and managed to crawl back above the 200-DMA, which currently stands at Rs 1,058. The daily MACD remains in ‘buy’ mode while the stochastic has shown a fresh ‘buy’ signal with a bullish divergence against price on the weekly charts. The pullback is likely to continue over the coming days. Any close below Rs 998 should be a stop loss for this trade.
Indraprastha Gas (IGL) | Buy | Target price: Rs 355 | CMP: 327
This stock is seen breaking out of a formation after moving above its long-term support-resistance line seen on the charts. As this breakout was taking place, the OBV or On Balance Volume, marked a fresh high, which acts as a confirmation on the volume front. The RS Line, which shows the stock’s relative performance against the broader market, has broken out of a pattern and remained above its 50-DMA. The stock has closed above its upper Bollinger Band. Though a minor pullback inside the bands cannot be ruled out, there is a high possibility that the upward momentum may continue on the counter.
Technical indicators show that the market may stabilise next week and make some technical pullback. The 11,140 and 11,230 levels are likely to act as key resistance points. Supports will come in at 11,900 and 11,810 levels.
Here are four stocks that look like potential buys for next week.

Mazhar Mohammad, Chartviewindia
ADVERTISEMENT
Voltas | Buy | Target price: Rs 641 | CMP: 601This counter appears to be on a consolidation mode after retracing 62 per cent of its last leg of rally from Rs 557-624 levels with a possible higher bottom around the recent low of Rs 579. Hence, if this counter resumes its bounce, then the initial hurdle can be around Rs 624 level, but once it manages to get past the said level, the Rs 641 level can’t be ruled out. Positional traders are advised to buy now and add further on declines between Rs 590 and Rs 585 levels and look for a bigger target at Rs 641. The stop loss suggested for this trade would be a close below Rs 578 level.
Ashok Leyland | Buy | Target price: Rs 73 | CMP: Rs 64
For last eight trading sessions, this counter consolidated in the narrow range of Rs 65-60 levels. This consolidation resulted in a ‘Hammer’ formation with long lower shadows on the weekly chart for last two weeks . Hence, traders can call a bottom with higher degree of confidence around Rs 60 for this counter. Positional traders are advised to make use of this opportunity to buy into this counter and look for a target of Rs 73. The stop loss suggested for this trade is a close below Rs 59.
ADVERTISEMENT
Gajendra Prabu, HDFC SecuritiesMarico | Buy | Target price: Rs 425 | CMP: Rs 392
This stock is trading near its lifetime high with a positive momentum and is likely to make a new high in the coming weeks as it saw a bullish breakout sometime back. Momentum indicators like MACD and KST are placed with a positive sign, which could keep the momentum intact. The price has been forming higher highs and lows in all the degrees, which is a bullish continuation structure. In addition, the stock is trading above all its key moving averages. Traders may look to buy the stock at CMP and add on dips to Rs 380 for an upside target of Rs 425 over the next two-three weeks. Place a stop loss at Rs 372 on a closing basis.
IDFC First Bank | Buy | Target price: Rs 50 | CMP: Rs 46
This stock has formed a higher top and bottom formation on the weekly chart, which is a bullish Dow formation. The stock price has validated the previous week’s Engulfing bull formation, which confirms a bullish reversal. Technical indicators MACD and RSI are placed with a positive sign, which could add strength to the positive momentum. Traders may look to buy the stock at the CMP and add on dips to Rs 44 for an upside target of Rs 50 over the next 2-3 weeks. Place a stop loss at Rs 43 on a closing basis.
Jay Thakkar, Anand Rathi Shares and Stock Brokers
Apollo Hospitals | Buy | Target price: Rs 1,570 | CMP: Rs 1,471
This stock has seen a breakout from the sideways channel, which was formed in its Wave 4 and Wave 5 up, seems to have started. Volumes have increased with this breakout and the momentum indicator MACD has also provided a buy crossover.
Bata | Buy | Target price: Rs 1,540 |CMP: Rs 1,474
This stock has seen a breakout from the sideways channel with a clear ‘buy’ crossover in the momentum indicator. With this breakout, it seems that the index has completed its Wave 4 consolidation and Wave 5 up seems to have started.
Sameet Chavan, Angel Broking
Maruti Suzuki | Buy | Target price: Rs 6,300 | CMP: Rs 5,975
Our strategy at this juncture would be to target a few marquee names that have been correcting since last many months and have reached their crucial supports on higher degree time frame charts. This automobile giant is clearly one of them. The market recently saw confirmation of a ‘Bullish Hammer’ pattern formed around the golden ratio (161 per cent) of the previous up move. There were some encouraging moves seen from the intra-week lows and hence, we expect further relief in this counter. Traders can look to initiate longs for a target of Rs 6,300 and the stop loss should be fixed at Rs 5,750.
Foreign brokerage CLSA said that earnings downgrade post June quarter results were quite substantial, even as numbers of companies missing the Street estimates were not that high. The foreign brokerage has cut its target on Maruti Suzuki, Indiabulls Real Estate while retaining its target on Indraprastha Gas (IGL). Here's what the brokerage said:


(Views and recommendations given in this section are the analysts’ own and do not represent those of ETMarkets.com. Please consult your financial adviser before taking any position in the stock/s mentioned.)
Too busy to trade in stocks? Invest in Mutual Funds with ET Money!
Bookmark or read stories offline -
Download ET Markets APP
Download ET Markets APP
ADVERTISEMENT

