With organized retail only 12% of overall retail and Reliance Retail bigger than the next 10 retailers combined, it is in pole position for growth leadership, the brokerage said. "Their contribution in consolidated EBITDA should increase from 37% ...
By ET Bureau | Updated:
Agencies
The brokerage said Reliance Jio should further consolidate its leadership position with 25% EBITDA CAGR and gain 450 bps revenue market share to 42% by FY23.
MUMBAI: Jefferies has initiated coverage on Reliance Industries with a buy rating and a target price of Rs 2,600 as it sees the oil-to-telecom conglomerate as a proxy for India's consumption growth story.
The brokerage said that a transition from B2B to B2C and a potential stake sale in the O2C business will usher in the next investment cycle in Reliance Industries. The brokerage said Jio should further consolidate its leadership position with 25% EBITDA CAGR and gain 450 bps revenue market share to 42% by FY23.
With organized retail only 12% of overall retail and Reliance Retail bigger than the next 10 retailers combined, it is in pole position for growth leadership, the brokerage said. "Their contribution in consolidated EBITDA should increase from 37% in FY20 to 49% in FY23," said Jefferies.
Maruti among 10 stocks that may help you beat the Street
1/11
As benchmark indices remain volatile, analysts are recommending traders to be stock specific, avoid aggressive shorts and stay cautious. Besides the increasing Covid cases in certain parts of India, traders are also worried over the US 10-year yield which is firm at around 1.62%. All eyes are now glued on the outcome of the Federal Reserve meeting tonight.
Here is a handpicked collection of 10 stocks that analysts believe can deliver impressive returns in the next few weeks:
As benchmark indices remain volatile, analysts are recommending traders to be stock specific, avoid aggressive shorts and stay cautious. Besides the increasing Covid cases in certain parts of India, ..
Read More
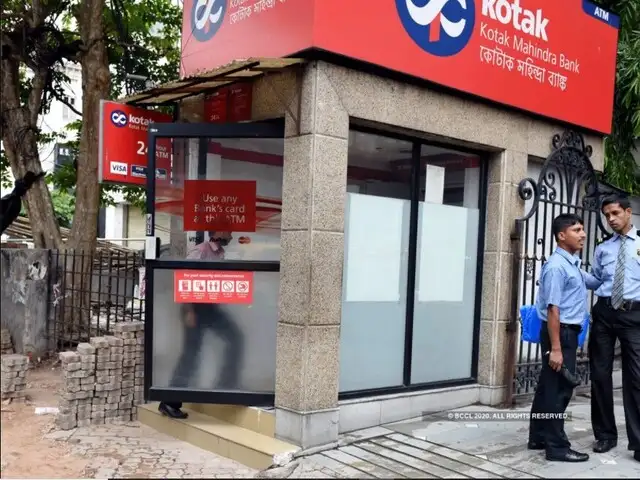
Nifty Bank index in the last four weeks has witnessed a shallow retracement of its strong post Budget rally of more than 25%, thus forming a higher base for the next leg of up move. Within the banking space, the analyst remains constructive on Kotak Mahindra Bank as it is seen taking multiple support at its 50-day EMA (Rs 1,893) and the rising demand line joining lows since September 2020. Among the oscillators, the daily MACD is seen sustaining above its nine-period average, thus validating a positive bias. The analyst expects the stock to retest its all-time high of Rs 2,050 in the coming weeks. Maintain a stop loss at Rs 1,840 on a closing basis.
(Analyst: Dharmesh Shah, Head - Technical, ICICI direct)
Nifty Bank index in the last four weeks has witnessed a shallow retracement of its strong post Budget rally of more than 25%, thus forming a higher base for the next leg of up move. Within the bankin..
Read More
The share price of Titan remains in a structural up trend, forming higher peak and higher trough in the long term chart. Strong buying demand emerged at major breakout area of November 2020 and the 50% retracement of the previous up move (Rs 1,154-1,621), thus providing a fresh entry opportunity with a favourable risk reward set up. Currently, the stock has taken 10 weeks to retrace 50% of its previous up move of 9 weeks (Rs 1,154-Rs 1,621). Such slower pace of retracement indicates a robust price structure. The analyst expects the stock to head towards Rs 1,615 level in the coming weeks as it is the confluence of the previous all-time high of January 2021 and 123.6% external retracement of its immediate previous decline (Rs 1,588-Rs 1,396). Maintain a stop loss at Rs 1,418 on a closing basis
(Analyst: Dharmesh Shah, Head - Technical, ICICI direct)
The share price of Titan remains in a structural up trend, forming higher peak and higher trough in the long term chart. Strong buying demand emerged at major breakout area of November 2020 and the 5..
Read More
The IT index is resuming its fresh up move after taking a breather in the last two months. Midcap IT stocks are witnessing strong momentum and continuing their primary up trend. The share price of L&T Infotech has generated a breakout above the bullish flag pattern, signaling the resumption of a primary up trend and offering fresh entry opportunity. The stock's 100-day EMA acted as a strong support point in the entire up move since May 2020. The counter has recently rebounded taking support at its 20-week EMA, highlighting a robust price structure. Based on the above technical observations, the analyst expects the stock to continue its current positive momentum and head towards Rs 4,435 levels as it the 138.2% extension of the previous week up move (Rs 3,570 to Rs 4,015). The analyst recommends keeping a stop loss at Rs 3,890 on a closing basis.
(Analyst: Dharmesh Shah, Head - Technical, ICICI direct)
The IT index is resuming its fresh up move after taking a breather in the last two months. Midcap IT stocks are witnessing strong momentum and continuing their primary up trend. The share price of L&..
Read More
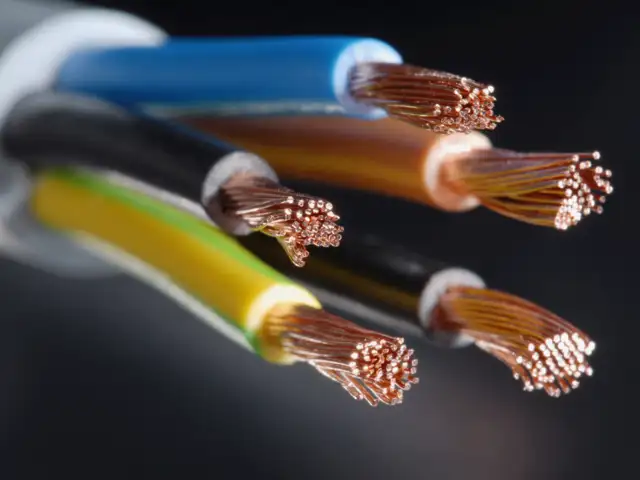
After moving into a sideways range over the last one month, the stock witnessed an up move on Tuesday and closed higher. This pattern indicate chances of a sharp upside breakout of the range of around Rs 525-550 levels. The weekly chart signals positive sequential movement like higher tops and bottoms. A further upside from here could form a new higher top of the sequence. Weekly 14-period RSI has turned up, which signals the strengthening of upside momentum in the stock. Buying can be initiated in KEI Industries Ltd at CMP (Rs 520.35), add more on dips down to Rs 500, according to the analyst who was a target of Rs 575 for the next 3-4 weeks. Place a stop loss at Rs 485.
(Analyst: Nagaraj Shetti, Technical Research Analyst, HDFC Securities)
After moving into a sideways range over the last one month, the stock witnessed an up move on Tuesday and closed higher. This pattern indicate chances of a sharp upside breakout of the range of aroun..
Read More
The weekly timeframe chart of Jagran Prakashan signals a sustainable upside bounce this week. After the formation of an upside gap in the later part of Feb, the stock price has sustained higher as of now. The said opening upside gap on the weekly chart remains intact around Rs 49.60-52.05 levels, three weeks after its formation. Hence, this is a positive indication and that gap could be considered as a bullish breakaway gap (which are associated with crucial bottom reversals). The daily and weekly 14-period RSI shows positive indication. One may look to buy Jagran Prakashan at CMP (Rs 60.05), add more on dips down to Rs 57 and wait for an upside target of Rs 67 in the next 3-4 weeks. Place a stop loss at Rs 55.
(Analyst: Nagaraj Shetti, Technical Research Analyst, HDFC Securities)
The weekly timeframe chart of Jagran Prakashan signals a sustainable upside bounce this week. After the formation of an upside gap in the later part of Feb, the stock price has sustained higher as of..
Read More
Inox leisure has been trading within the range of Rs 356-Rs 310 since January 2021. This sideways range is taking the shape of a descending triangle. Descending triangles are regarded as a continuation pattern and they have a high rate of success in a bullish market. The stock is also emerging out of a strong basing pattern formed between June 2020 to January 2021. Longer term moving averages show an up trend as 50-period moving average is above the 200-period moving average. Once the stock price breaks above the minor resistance level of Rs 337, expect a rally towards Rs 370 and above that to Rs 400. The analyst recommends buying and holding for at least 6-8 weeks and keep a stop loss at Rs 310.
Inox leisure has been trading within the range of Rs 356-Rs 310 since January 2021. This sideways range is taking the shape of a descending triangle. Descending triangles are regarded as a continuati..
Read More
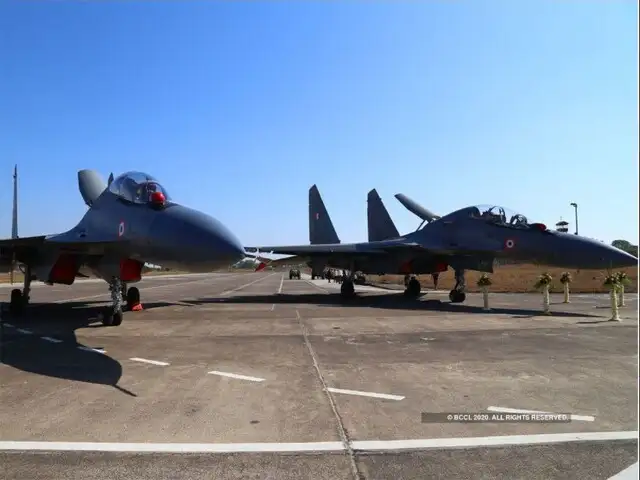
Defence stocks have been in the limelight since the last couple of weeks and HAL is a strong performer. The stock price is in a steady uptrend with a clear pattern of higher highs and higher lows. The price has corrected from its recent high at Rs 1,117 and has descended towards its previous swing high of Rs 1,009. If we join the lows from November 2020 to the low of December 2020, price touches this rising trendline. The 50-period moving average is placed at Rs 1,000 and this average is also offering support to the price. On Tuesday, the stock saw a long green candle which is a railroad track and suggests a change in sentiment. Price seems to have completed the entire decline from Rs 1,122 and it is now likely to continue its movement upwards. HAL is a first class stock with a brimming order book. Buy HAL for a rally to Rs 1,150 and above that to Rs 1,250 over the next 6-8 weeks. Keep a stop loss below Rs 900.
Defence stocks have been in the limelight since the last couple of weeks and HAL is a strong performer. The stock price is in a steady uptrend with a clear pattern of higher highs and higher lows. Th..
Read More
The stock is trading above its 200-EMA, which indicates a positive outlook on the stock. Coforge is trending in an upward trending channel and is reversed from the support line of the channel. The analyst recommends a buy on the stock for a target of Rs 2,845 from a medium-term perspective. Keep a stop loss at Rs 2,480.
(Analyst: Ashis Biswas, CapitalVia Global Research Limited)
The stock is trading above its 200-EMA, which indicates a positive outlook on the stock. Coforge is trending in an upward trending channel and is reversed from the support line of the channel. The an..
Read More
The stock is trading above its 200-day EMA, which indicates a positive outlook on the stock. Maruti is also trading in an upward trending channel and has even reversed from its 8 & 50-EMA support. The analyst recommends a buy on the stock for a target of Rs 8,480 in the medium-term. He suggests keeping a stop loss at Rs 7,169.70.
(Analyst: Ashis Biswas, CapitalVia Global Research Limited)
The stock is trading above its 200-day EMA, which indicates a positive outlook on the stock. Maruti is also trading in an upward trending channel and has even reversed from its 8 & 50-EMA support. Th..
Jefferies said liabilities have reduced adequately and proceeds from a potential minority stake sale in its O2C business to Aramco will create a large war chest.
"Going forward, we expect Jio's capex to moderate owing to leadership in network capex, recent large spectrum acquisition and moving fiber related capex to an InvIT. This should help Jio turn free cash flow positive FY22 onwards," said Jefferies. "The energy business should also generate strong free cash flow as the margin environment recovers. We forecast over US$6 billion per annum of free cash flow generation at consolidated level from FY22 onwards," said Jefferies.